Technical analysis posits that trends, once established, have greater odds of continuation than of reversal, notes Corey Rosenbloom of AfraidToTrade.com, and Google and Amazon are just two examples that support this thesis.
Not to be outdone by Google’s breakout above $1,000 per share on Friday, Amazon (AMZN) shares also broke to all-time highs to continue the persistent uptrending action already in motion.
Let’s start with the weekly trend structure and then move to the current daily breakout:
One of the foundational principles of technical analysis states that “trends, once established, have greater odds of continuation than of reversal.”
While there are many examples to support this thesis, Google (GOOG) and Amazon (AMZN) provide the newest examples of the pro-trending principle.
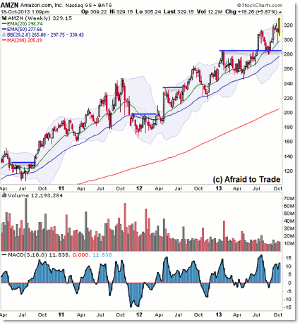
Amazon has officially remained in a monthly or primary uptrend (monthly chart) since the 2002 price low near $20.00 per share though we only see the weekly perspective from late 2010 to present.
I drew blue horizontal lines to represent prior breakouts from sideways resistance or consolidation areas and we can see the (then) future action after the breakout events occurred.
We’re always to be on guard for a “trap” outcome, but if sellers do not spring a bull trap, odds do tend to favor additional continuation after a breakout event occurs.
We can see how shares retraced toward then supported near either the rising 20- or 50-week EMA (exponential moving average), which serves as a reference level both as a target for short-sellers (trading counter-trend retracements) and new buyers looking to enter a pro-trend environment with reduced risk.
Also like Google, Amazon retraced back to the breakout level into $280 per share from the most recent breakout-into-retracement event.
With the broader trend structure (and historical breakouts) in mind, let’s turn our focus to the daily chart:
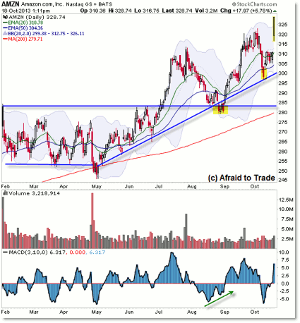
As noted in prior updates here and here, shares entered a sideways trading range through the early part of 2013. The eventual breakout in July set the stage for the impulsive upside action that carried share prices to the breakout level we’re seeing now (along with the weekly structure mentioned above).
Let’s briefly discuss the early September bear trap into $280 per share.
It’s typical to expect an initial retracement after a breakout; in fact, initial retracements often provide ideal trading opportunities with low risk.
The ‘first reaction’ did take price toward the support target at the “pattern breakout” trendline into $285 per share. However, price spent a few days under the critical support level to force a “make or break” situation.
While we can see in hindsight that price did support just under this level, we can use it as a reference level in real-time adaptation and trade management.
Those who used tight stop-losses under the pure trendline were stopped out, only to see price behave exactly as expected (supporting at the trendline then rallying up to new highs).
Traders who used more aggressive or wider stops under $280 were far more likely to remain in a ’support-buy’ position ahead of the breakout. It’s a lesson in the need to have confidence in a position that allows us to withstand the “wiggles and squiggles” of price as it interacts with a critical and obvious inflection level.
Nevertheless, shares continued the uptrend, completed another retracement, and now achieved the breakout Friday morning.
While there’s additional lessons to study with the pro-trend, retracement, and breakout opportunities in a prevailing uptrend, be sure to watch price currently into the $325 breakout level and potential for additional “feedback loop driven” upside price action.
By Corey Rosenbloom, CMT, Trader and Blogger, AfraidToTrade.com


