

This pattern seen in Amazon's chart tends to build to a crescendo followed by a painful reversal after the movement turns vertical, notes Corey Rosenbloom of AfraidToTrade.com.
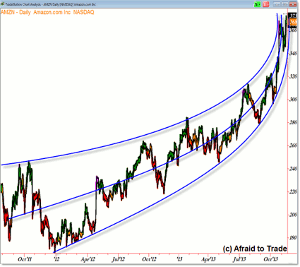
We continue to watch Amazon.com (AMZN) trade within what seems to be the latter stages of a parabolic arc or explosive vertical impulse pattern.
I’m a big fan of these "parabolic arc trendline” patterns—let’s update the current chart of Amazon’s textbook parabolic arc trend structure.
Click to Enlarge
Amazon shares have traded steadily between rising "arc" trendline boundaries. It’s important to note that trendlines can and often do take the form of “arcs”—there’s nothing at all that says trendlines must be straight lines.
Price movement—and crowd psychology—shows up on the chart as these type of patterns, which reflect increasing attention, enthusiasm, and excitement over time.
It tends to build to a climax ahead of a painful reversal or collapse after the movement literally turns vertical in shares.
We see a similar situation though not as cleanly structured with FedEx.
Note the compression (reduction) of volatility—meaning price range between the upper and lower trendlines—in the context of this recent parabolic move from July to present.
The trendlines have compressed together as the price activity becomes more urgent (either to buy shares or cover short-sold positions).
In general, the bulk of a price movement in a trend can emerge at the latter phases or during this "parabolic" price pattern.
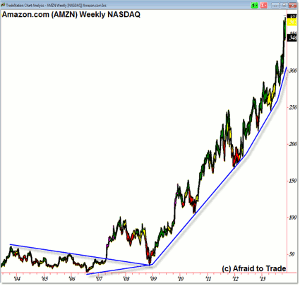
We can step back to the weekly chart to see how the move began and how the structure accelerated.
Click to Enlarge
From the 2007 structural breakout above $50 per share, price began a long-term powerful impulsive uptrend that continues with the daily arc pattern in motion currently.
Were it not for the 2008 recession, one would assume shares would have began the ascent quicker, though we will note that Amazon shares bottomed at $35 per share on November 20, 2008, which was four moths ahead of the broader stock market bottom in early March 2009.
With that in mind, shares have continued their primary bull market uptrend.
Note the steepening increase in the lower trendline—this is a concept I like to call “angular momentum” where we have to update trendlines (by increasing the angle) to connect the series of new higher lows.
By Corey Rosenbloom, CMT, Trader and Blogger, AfraidToTrade.com


