

If you’re one of those traders who are currently on the ledge as the stock market struggles for direction, Greg Harmon of Dragonfly Capital offers an alternative view.
Does this chart scare you? I think it scares a lot of traders. Everyone has their own piece they focus on. It might be the failure to hold a new all-time high. It might be the length of the upper shadow on the candle Monday. The human brain is hard wired to avoid risk as a reflex action so maybe it is just that the S&P 500 (SPY) is back at previous levels and your reptilian brain is screaming get your money safe.
There are plenty of bullish aspects of this chart too though. The relative strength index is in the bullish range and pointing higher. The Bollinger bands are opening higher. All of the moving averages are below price. But none of that matters if you are looking for a reason to sell.
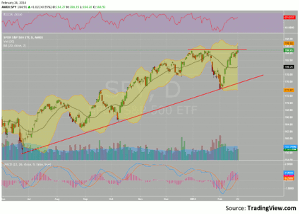
Click to Enlarge
But let me give you one more piece of information to consider. The S&P 500 is an index of 500 stocks. Not just a straight, put $100 into each name index, though. Stocks have different weightings based on their market capitalization. Large companies have bigger weightings than smaller companies. This is important.
Do you know how much Apple (AAPL) or General Motors (GM), or Chipotle Mexican Grill (CMG) will move the S&P 500? Me neither. In fact the only people that do know trade with computer programs to measure and arbitrage that impact. Why is that important? It means that traders in the S&P 500 (SPY, SPX or E-Mini S&P Futures) don’t know about the individual companies. In fact, they couldn’t care less.
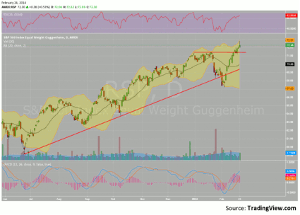
Click to Enlarge
They are trading the index value only. To you and I who trade individual stocks that means there are opportunities in individual names. But it also means that there are possibly better tools to look at to determine the strength of the market.
Above is one of them. It is the S&P 500 Equal Weighted Index ETF (RSP). Every stock carries the same weighting. It tells quite a different story. There was a false breakdown to start the month and a now a breakout of resistance to new highs. Sit down and think about what this means. The cap-weighted SPY is level while the equal-weighted RSP is making new highs. Same 500 stocks. For one thing, it shows that smaller stocks in the index are leading. Second, the broad market is increasing, just not in a cap-weighted manner. This could ultimately pull back as well, but for now, it shows that the securities in the S&P 500 are healthy and their stocks are moving higher, just not in a way that index traders like.
By Greg Harmon of Dragonfly Capital


