When it comes to investing or trading, hindsight is always 20-20, says Jared Cummans of ETFdb.com.
There are dozens of occasions when the “could have, should have” mentality applies to making portfolio allocations, especially if you missed out on big gains. There are, however, situations in which investors can breathe a sigh of relief that they did not execute certain positions that eventually turned sour. Below, we show you 10 of the worst ETF trades and investments of all time; hopefully you are able to look back and say you were not on the losing end of any of these positions.
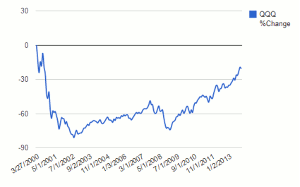
10. QQQ Gets Its Bubble BurstThe late ’90s saw a technology craze with stocks reaching never before seen highs and the Nasdaq eventually hitting an all-time high that it has yet to see again. Sentiment was bullish and it was a buying frenzy in the stock world, making the QQQ Fund (QQQ) (then dubbed “QQQQ”) a hot commodity. However, had you bought the fund at its peak on 3/27/2000 at $117.75, you would have been in some serious trouble.
On 10/9/2002, QQQ’s all-time low of $20.06, you would have lost nearly 83% of your investment. Had you held that position until today, you would still be down a little over 30%.
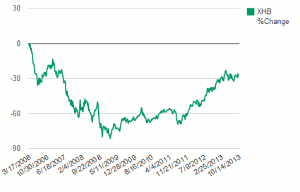
9. …And XHB Follows SuitAnother one of the biggest bubbles to infect ETFs was the run-up in the housing market in the mid-2000s. Yet another asset class that experienced jubilation and gave many a sense of false invulnerability. The buying frenzy led to the SPDR Homebuilders ETF (XHB) hitting an all-time high of $42.17 on 3/17/2006, not long after its inception. The fund would then suffer a correction followed by a period where it seemed to get back on track; that was followed by a burst of the bubble and a collapse for the ETF.
Had you bought XHB at its all-time high, you would have lost approximately 81% on 3/9/2009, when it hit an all-time low of $7.80. Had you held on to the ETF until today, your position still would have yielded a loss of 27%.
8. Not All that Glitters Is Gold
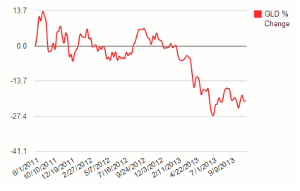
The latter part of 2011 saw gold hit its all-time high, as it seemed that the commodity was unstoppable. The bullish feeling on gold was that there was literally no limit to how high its price would go, helping the SPDR Gold Trust (GLD) to briefly become the largest ETF in the world. But buying in at those peaks had rough consequences for some. GLD made its all-time high of $184.59 on 8/23/2011 and has been nothing but a disappointment since.
Had you bought GLD at its all-time high, you would be down just over 31% currently. GLD is set to have its first-ever negative calendar year in 2013 unless it is able to make a major turn-around.
7. Financials in a Frenzy
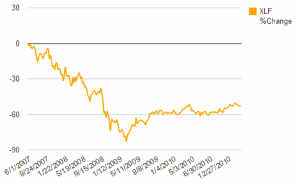
Prior to the collapse of Lehman, the financial space had been heating up, enjoying a nearly five-year long bull-run. That made the Financial Select Sector SPDR (XLF) one of the hottest funds on the market at the time. XLF made an impressive all-time high of $38.02 on 6/1/2007. Then things started turning south, culminating with the collapse of Lehman.
Had you purchased XLF at its peak, you would have been down nearly 84% at the fund’s all-time low of $6.18 and you would still be down 45% today.
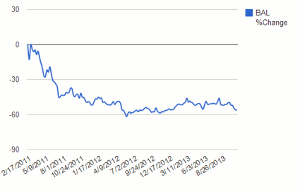
6. Soft Commodity Delivers a Hard HitCotton is one of the most popularly traded soft commodities as it offers a fair amount of volatility for those who can stomach its often large daily movements. Subsequently, the Dow Jones-UBS Cotton Total Return Sub-Index ETN (BAL) is a favorite among commodity traders. BAL and cotton enjoyed a massive run-up from 2010 into early 2011, where BAL made its historical high of $111.00 on 2/17/2011.
From there, is has been all downhill; had you bought in at its high, when analysts and the Street were bullish on the commodity, you would be down nearly 56% today.
NEXT PAGE: 5 More Nightmare ETF Trades
|pagebreak|5. Getting Gutsy with TVIX
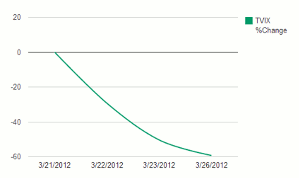
The Daily 2x VIX Short-Term ETN (TVIX) is one of the most volatile ETFs in the world, as it is known for its wild daily movements. A number of traders use the fund to speculate on economic news and announcements and there are those who have made a killing with it, but a long list of others have been burned. In early 2012, there was a two-day period in which TVIX saw its price get slaughtered.
On Wednesday, 3/21/2012, the fund closed at $14.43. It would go on to close at $10.20 the next day and close at $7.16 on Friday 3/23/2012. Its final blow came the following Monday, when the fund closed at $5.88. All in all, anyone who was long TVIX for those three days watched their position decline by nearly 60%, all due to an interesting nuance that caused the fund to trade in a curious manner.
4. Crude Oil Extinguished
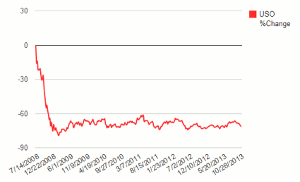
In 2008, the price of a barrel of oil was soaring, causing many to worry about the long-term ramifications for the economy. At the time, traders and investors were going crazy for the United States Oil Fund (USO), as it would hit an all-time high of $117.48 on 7/14/2008.
Shortly thereafter, oil prices tanked and have yet to reach that level. Had you bought USO at its peak, you would be down approximately 70% today.
3. UNG’s Never-Ending Woes
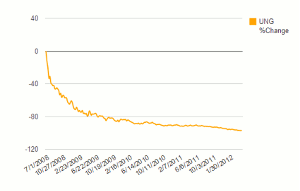
While the United States Naural Gas Fund (UNG) is among the most popular ETFs in the world, it has also been one of the worst performers. The fund has been on the bitter end of rising natural gas production and plummeting prices, making it one of the worst-performing ETFs of all time. UNG had a run-up in 2008, similar to USO, and peaked on 7/1/2008 at an adjusted close of $507.84. Adjusted closing prices are necessary to use because UNG has reverse-split multiple times in order to keep its price from getting too low.
Had you bought in at UNG’s peak, you would be down approximately 96% today.
2. VXX Never Stood a Chance
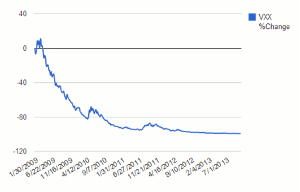
The S&P 500 VIX Short-Term Futures ETN (VXX) debuted just after the 2008 crash and after much of the volatility subsided. The five-year bull run in major equities that ensued absolutely destroyed the fund. It should be noted that VXX is primarily designated as a trading instrument, not meant to be held for the long-term, but there are many perma-bears out there who thought the markets stood no chance in 2009.
Had you purchased VXX on its first trading day, you would have lost 99% of your investment as the fund has been trending mostly straight down (save for a few brief bouts of volatility) for its entire life.
1. The Trade You Hope You Didn’t Miss
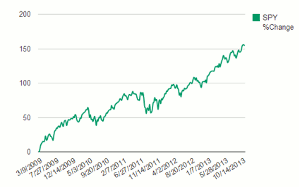
Sometimes the worst trades are the ones you did not make. Such is the case with the SPDR S&P 500 ETF (SPY). Coming out of the 2008 collapse, dozens of analysts and investors were calling for a double-dip recession and warned that things would soon get even worse. Throughout the years, many maintained this sentiment watching the losses rack up on the sidelines. The worst ETF trade ever made was not buying into SPY in 2009.
Since hitting a bottom of $68.11 on 3/9/2009, SPY has been on an absolute tear, only stopping briefly to collect itself before charging further ahead. The fund is up more than 150% since its ’09 low and perma-bears couldn’t be more frustrated.
By Jared Cummans, Contributor, ETFdb.com


