Technician Corey Rosenbloom of AfraidToTrade.com demonstrates a trading plan based on a popular tech stock’s most recent breakout.
Like many other similar stocks Monday, Netflix (NFLX) generated a potential breakout buy signal on a shattering of overhead resistance.
Let’s focus our attention on a near-term upside target along with an open-air breakout pathway should the next higher target also fail to hold the onslaught of recent buying pressure.
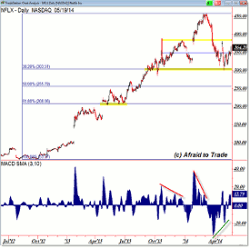
Here’s a simple planning chart of the trend and Fibonacci reference levels:
The chart above shows a persistent uptrend in motion (from mid-2012’s support shelf and impulsive break above $100 per share) that reversed initially into the $450 per share level.
We’re seeing a similar situation occur in Apple (AAPL) above the $600 level.
Price retraced all the way back to the 38.2% and price confluence into $300 per share, which—of course—is a key level that buyers MUST hold firm (and so far, they have done so successfully).
This led to a push up from positive divergences into the current $350 pivot level from which Monday’s breakout and short-term buy signal occurs.
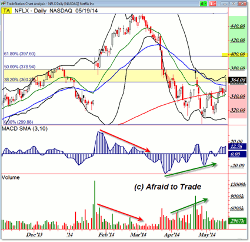
Let’s step in the perspective to see the breakout and two upside target levels to play for should the bullish action continue:
The $356 per share level was the falling 50-day EMA along with the new 38.2% Fibonacci retracement (to the upside) at $360 per share.
Buyers shattered both of these levels—at least so far—and our attention now is on whether price holds above $365 (which is a bullish signal that immediately targets $380) or else fail to hold Monday’s gain, which would ‘trap’ traders and likely create a short-sale breakdown (bull trap).
It’s the $360/$365 level that will help us plan the next set of trades.
Again, a continuation impulse here should target the Fibonacci and price resistance cluster near $380 per share.
If this happens, expect a pause/consolidation or retracement against this level initially.
However, if buyers also shatter this resistance ceiling, look to play another potential breakout impulse as price enters “open air” above $380 toward $400’s 61.8% Fibonacci target (and beyond that should buyers also squeeze above $400).
When planning trades, focus on the near-term levels and short-term targets—then monitor price as it moves toward or away from these levels (trade strategies—even on the intraday frame—develop within this context).
By Corey Rosenbloom, CMT, Trader and Blogger, AfraidToTrade.com


