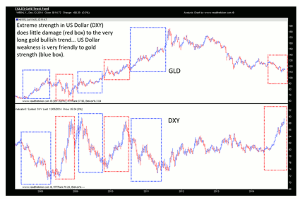
The staff at Readtheticker.com charts gold in relation to the USD over the last decade and illustrates how, historically, big moves in the dollar have not sent gold plummeting. They also point out what to expect when the US dollar strength excitement has finally run its course.
Well, for the last decade, anyways.
Chart below is a weekly chart of GLD and DXY.
As shown below, powerful moves in the USD (DXY) do not send gold crashing. The USD looks like it is completing a A-B-C correction. Once the C is done, and the DXY falls, gold will do well. How much longer for the DXY? The strong rally may last three to five weeks more and then will stall and start to consolidate, what happens after that will be very interesting.
The main point is that US dollar strength is not trashing the gold trend, this is good relative strength and shows bulls defending the long-term trend. When excitement runs out for the DXY, the GLD will do well.
A note to members, we must see strength enter the gold market and a confirmed sign that behavior has changed from selling to buying.
Investing Quote...
"Vibration is fundamental; nothing is exempt from this law; it is universal, therefore applicable to every class of phenomena on the globe." ~ William D Gann
"It's easier to fool people, than to convince them they have been fooled" ~ Mark Twain
By the staff at Readtheticker.com


