

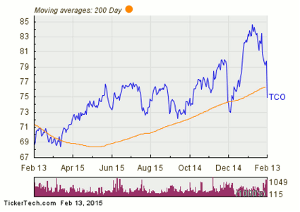
The staff at DividendChannel.com charts this shopping center management company’s stock—which crossed below its 200-day moving average last Friday—and highlights the stock’s one year performance by citing the high and low point in its 52-week range.
In trading on Friday, shares of Taubman Centers, Inc. (TCO) crossed below their 200-day moving average of $76.39, changing hands as low as $74.25 per share. Taubman Centers, Inc. shares are currently trading down about 6.4% on the day. The chart below shows the one year performance of TCO shares, versus its 200-day moving average:
Click to Enlarge
Looking at the chart above, TCO's low point in its 52-week range is $67.48 per share, with $85.2632 as the 52-week high point. That compares with a last trade of $74.65.
TCO makes up 3.03% of the PowerShares Active US Real Estate Fund ETF (PSR), which is trading relatively unchanged on the day Friday.
By the Staff of DividendChannel.com


