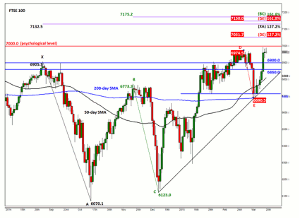
Even though Friday was a quiet day in the financial markets with a lack of market moving events, the staff at Forex.com highlights how that didn’t stop the FTSE (Footsie) from edging higher to a new all time high. The staff also offers a key area for traders to watch moving forward.
It was understandably a quiet day in the financial markets, with the lack of any major market moving events. But that hasn't stopped the FTSE from edging to a fresh record high Friday. The index of top UK shares is led by a 4% gain in shares of CRH, which rallied on announcement of a planned multi-billion-euro merger with Holcim and Lafarge. Also supporting the FTSE Friday is Tullow Oil, which is up 3.5%, after the oil producer raised an additional $450 million from existing lenders to boost its financial strength amid the weaker oil prices. Overall, the stock market sentiment remains bullish thanks mainly to the recently-announced bond buying program from the ECB, the surprisingly dovish remarks from the Fed last week, and the extremely accommodative monetary policies of most other major central banks.
But it is no secret that the FTSE has underperformed its European peers so far this year, not least the flying German DAX index, which is hovering around the 12,000 mark. As well as the ECB giving the European markets a shot in the arm, the commodity-heavy FTSE index has been held back the slump in commodity prices, which has weighed heavily on the share prices of energy and mining companies. The relatively small number of technology stocks—a sector which has given the US markets a major boost recently—has also held back the UK index. Nevertheless, we think that the ECB's QE program and the record low interest rates across many developed economies, including the UK, combined with a much weaker oil price will spur economic growth in the EuroZone—the UK's largest trading partner—and help push the FTSE to much higher levels in the coming months. We also think that oil prices may bottom out around the middle of 2015 as US shale producers are forced to cut back production due to oil prices remaining weak for a prolonged period of time. This could be good news for the commodity-heavy FTSE 100. But the on-going uncertainty surrounding the UK election is likely to hold some investors back for the time being. Once the elections are out of the way, and depending on its outcome, investors may decide it is time to pile back into the markets. That said, the FTSE is comprised of large multinational corporations, and as such, the outcome of the election may not have a big or lasting impact on the FTSE, though certain stocks or sectors could be affected nonetheless.
Although the FTSE has hit a couple of record highs recently, this has come after a laborious two years of trying. The FTSE's technical outlook appears more constructive after the buyers recently managed to hold their ground above the 200-day moving average and the bullish trend line around 6690 (point E on the chart). The index also held above the prior low of 6715 on a closing basis. Consequently, the index went on to break through the 6860-6900 resistance area once again. Meanwhile, the 50-day moving average has recently risen above the 200, thereby creating a so-called “Golden Crossover.” But things could change quickly and another break below the aforementioned range could lead to the breakdown of the bullish trend line and cause a more profound correction. However, as things stand, the chances are the FTSE may continue pushing further higher, for the reasons stated above. From a purely technical point of view, the fact that the index has spent nearly two years trying to break through the 6900 resistance level means there are probably plenty of fresh would-be buyers who may decide now is the time to come into the market. As such, the FTSE could be gearing up for a major breakout soon. As the FTSE is trading in unchartered territories, there are no prior price reference points for traders to keep an eye on. This is where Fibonacci extension levels come in handy. On the chart, we have plotted the Fibonacci extension levels of the last three notable price swings, from point X to A, B to C, and D to E. These extension levels could potentially turn into resistance as some speculators would use them as their long profit targets or short entry points.
By the Staff at Forex.com


