

By comparing the late July 2014 alignment with the bullish breakout pattern and recent strong rally of this tech stock, technician Corey Rosenbloom, of AfraidToTrade.com, illustrates how he’s been able to determine that shares could trade higher in a similar outcome to what was seen in 2014.
Twitter (TWTR) is back in the news with a bullish breakout and a strong recent rally.
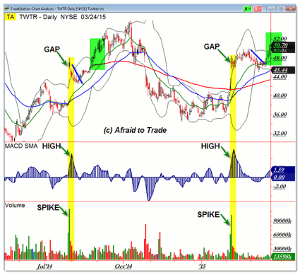
There’s an important pattern in price, momentum, and volume aligning that suggest even higher price highs are more likely to come in the near-term future.
Let’s See the Pattern and Chart the Levels in the Relatively New Stock Twitter (TWTR):
Click to Enlarge
Before viewing the current action, let’s study the late July 2014 alignment and compare it to what’s happening now.
Twitter rallied up off an inflection/reversal low near $32.00 per share to break into a new daily chart uptrend.
Pay particular attention to the yellow highlight which reveals…
- A Gap in price and new breakout high
- A New Momentum (Oscillator) High
- A Large Spike in Bullish/Buy Volume
Taken together, the alignment of a new breakout price high when confirmed with momentum and bullish volume all suggest that higher price highs are yet to come after a pullback (retracement).
Twitter, indeed, did retrace to the $44.00 per share level (rising 20-day EMA) and then the new price high—forecast from the triple alignment—occurred in September (green highlight).
A negative divergence and distribution volume in October signaled the end of the short-term bullish trend and price reversed to a downtrend.
We saw an end to the downtrend this time off the $36.00 per share level as yet another Bullish Gap was confirmed with a New Momentum High and a similar Bullish Spike in Volume.
Already, we see the new price swing high trigger with Tuesday’s bullish breakout event.
The suggestion—from the alignment and repeat pattern—is that Twitter shares could trade higher in a similar outcome to what we saw in 2014.
If history repeats—or creates a similar echo—then look for Twitter shares to continue trading higher at least toward the $52.00 to $54.00 level and likely higher than that on a breakout to new all time chart highs.
Plan your trades around retracement and breakout events that occur in real time under this bullish pathway.
By Corey Rosenbloom, CMT, Trader and Blogger, AfraidToTrade.com


