Chris Kimble, of Kimble Charting Solutions, takes a technical look at this scorching healthcare ETF that’s been on fire over various time frames and what another breakout of resistance could mean moving forward, since it continues to outperform the broad market.
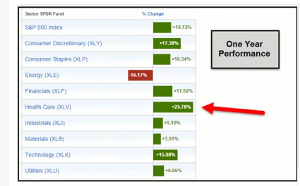
When one looks back over the past year, Select Sector Health Care ETF (XLV) has been a good place to be. The above table looks at the nine key sectors of the S&P 500, which reflects that XLV has done really well, grabbing the #1 spot over this time frame. Year-to-Date, XLV remains in the top spot as well.
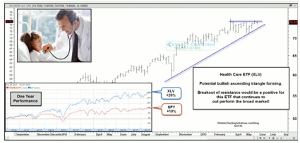
Can this hot performance continue? Check out the pattern XLV has been forming the past few months.
Over the past 90-days, XLV remains at the top spot as well, up a little over 2%. XLV could be forming a bullish ascending triangle, as it looks to have nearly a flat top and rising bottoms.
Two-thirds of the time, this pattern leads to higher prices.
The key for XLV at this time is for it to break above the nearly horizontal resistance line. Should it breakout and the pattern read be correct, the measure move would suggest that XLV could push 10% higher quickly.
Full Disclosure—Kimble Charting Solutions’ Premium and Sector members are long this ETF.
By Chris Kimble, Founder, Kimble Charting Solutions


