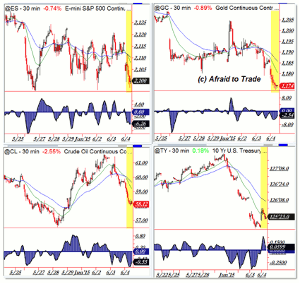
Technician Corey Rosenbloom, of AfraidToTrade.com, offers a multi-market grid plotting Thursday’s price movement for the ES Futures, Gold, Crude Oil, and 10-Year US Treasuries, not only to determine where money’s flowing, but also where it’s going.
Thursday we’re seeing volatility spike in all markets with a Risk-Off perspective sweeping the scene.
Let’s plot Thursday’s price movement and determine where money’s flowing…and where it’s going.

WTI Oil—Weekly Chart
Click to Enlarge
First, money is leaving stocks, gold, and oil as breakdowns have developed in each of these Risk-On markets.
Stocks moved down away from the 2,120 level toward the 2,100 pivot target where we are now.
Gold broke down away from the $1,200 level—out of a small rising trend line channel—and it’s now at the $1,175 pivot.
Oil—as was logical—broke down away from $61.00 on a clear negative divergence and now tests the $58.00 level.
Treasuries are catching a bid with a bounce up off the 125 level.
The Grid above is the short-term picture of Risk-Off protection and sell-swings/breakdowns as noted.
Even if you don’t trade these markets, it’s helpful to plot money flow in terms of Risk-On or Risk-Off across the board.
By Corey Rosenbloom, CMT, Trader and Blogger, AfraidToTrade.com


