The staff at BespokeInvest.com breaks S&P 500 stocks up into deciles based on dividend yield to determine the impact higher interest rates can have on the stock market. They also take a technical look at how US stocks have been performing relative to the rest of the world (ROW) and within the US.
High Yielders Underperforming Since Last Fed Meeting
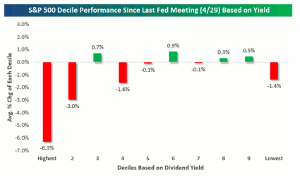
The average stock in the S&P 500 (SPX) (SPY) is down slightly since the last Fed meeting on April 29. With interest rates up quite a bit since then, however, stocks with high dividend yields have been crushed.
Below we have broken up the S&P 500 into deciles (ten groups of 50 stocks each) based on dividend yield. Decile 1 contains the highest yielding stocks while decile 10 contains stocks with low or no dividend yields. As shown in the chart below, the top two deciles of highest yielding stocks have gotten crushed since the last Fed meeting, while the remaining deciles have performance numbers around the flatline.
These performance numbers highlight the impact that higher rates can have on the stock market. Stocks in the Utilities (XLU) and Consumer Staples (XLP) sectors that have done very well in recent years as rates have trended lower will likely continue to underperform going forward if rates keep heading higher. If bonds decide to rally again—sending yields lower—you'll see investors move back into high dividend-paying names.
Relative Strength: US vs. ROW and Small vs. Large
In the charts below, we wanted to take a look at how US stocks have been performing relative to the rest of the world (ROW) and then within the US, which size stocks are doing the best.
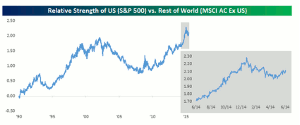
The first chart shows the relative strength of the S&P 500 versus the dollar-denominated MSCI All Country Index Ex US. When the line is rising, US stocks are outperforming the rest of the world and vice versa. Going back to 1990, US stocks have handily outperformed their international counterparts, but it hasn't been a straight line. From 1990 through 2001, the S&P 500 saw nearly uninterrupted outperformance, but that strength peaked shortly after the turn of the century when international equities took the reins of leadership. Strength on the part of international equities maintained in place for several years right up until the financial crisis. Then, out of the Financial Crisis, the US led the global equity market and has maintained its leadership role with nothing more than short-term hiccups along the way.
A closer look at the S&P 500's relative strength in the last year shows that US relative strength experienced one of those hiccups in early 2015 just as US economic data was beginning to stall and European economic data started surprising to the upside. There has been a good deal of agreement among economists that the weakness in US economic data was temporary in nature due to transitory factors like the severe winter and port issues on the west coast. In addition, there is a strong consensus arguing that seasonal adjustments to economic data are inaccurate and skewing the reported numbers. Looking closely at the relative strength chart, there are some signs that the market agrees with this logic as the US has started turning higher again relative to global equities.
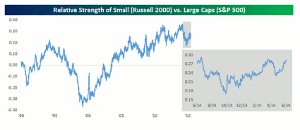
It remains to be seen whether US stocks will resume their strength relative to the rest of the world, but within the US market, small-cap stocks are a little further ahead in taking back the leadership role. Small-cap stocks have generally been leading large-cap stocks in the US ever since late 1999, but it hasn't been a smooth road. In fact, last spring the relative strength of the Russell 2000 made a double top and dropped sharply relative to the S&P 500 through late last Fall. The Russell's relative strength bottomed in mid-October and since then has rallied back. With small-cap stocks generating most of their revenues in the US, relative strength in the small-cap space would be another sign that investors are looking past the short-term weakness for more consistent growth going forward.
By the Staff of BespokeInvest.com


