Technician Corey Rosenbloom, of AfraidToTrade.com, shares three stocks in the S&P 500 with Rising Wedge price patterns, highlights why these three stocks were chosen, and suggests traders seek out additional candidates from their own individual stock scans.
Which three Top Stocks in the S&P 500 with Rising Wedge price patterns are we highlighting?
Let’s take a look at the pattern and these three big names from our scan:
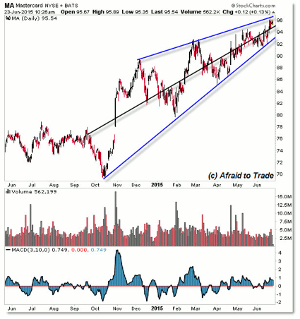
We’ll start with MasterCard (MA):
The Rising Wedge pattern is also called the Bearish Rising Wedge pattern, but the pattern only takes a bearish turn (signal) when price breaks under the lower rising trendline.
Until that happens, the pattern is actually quite bullish and represents a strongly uptrending stock.
The goal is to play (plan) trades within the compressing trend lines, often buying retracements or breakouts as price moves higher in its trend.
Continue this buy retracement in a trend strategy until price does break through the lower trend line.
When trading a rising wedge pattern, note the following:
- Lower Support Trend Line (often a buy point until price breaks under it)
- Midpoint (which acts like a Magnet or anchor for a Rubber Band)
- Upper Resistance Trend Line (a target and place for aggressive traders to sell short)
I used the quick scan (screen) tools from FinViz.com and highlighted these three S&P 500 candidates.
For Mastercard (MA), we see clearly compressing trend lines focusing on the $95.00 per share level.
The lower support trend line—a sell-short signal if broken—currently appears at the $94.00 level.
As the trend lines converge (and price overlaps), energy builds for a future breakout.
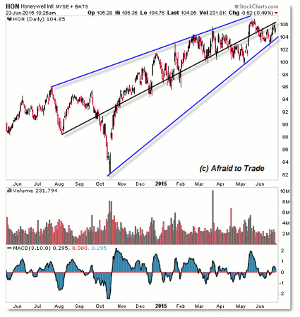
Here’s another top stock which is also a Dow Jones component—Honeywell:
Honeywell (HON) does not have the clearly defined trend lines as Mastercard, but we still see the Rising Support line into $104.00 per share and the Midpoint just above $106.00 per share.
The rising upper trendline target extends beyond the scale of this chart but appears near $109.
Watch the $104.00 support and the prior $102.00 per share low for a possible downside trigger to reverse this strong—but potentially weakening—uptrend.
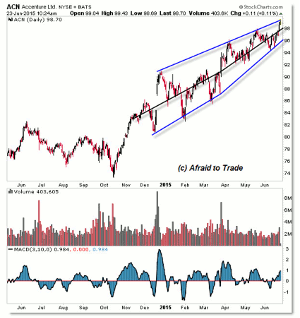
Our final candidate is Accenture:
Like Mastercard, Accenture (ACN) shows a compressing trend line pattern forming around a Midpoint.
The estimated levels are $96.00 for the support line, $98.00 for the Midpoint, and $100.00 for resistance.
Again, the general idea is to play trades within the range as buyers and sellers play ping-pong, bouncing price between these levels (centered around a rising midpoint).
These are just three leading names; you can seek out additional candidates from your stock scans.
By Corey Rosenbloom, CMT, Trader and Blogger, AfraidToTrade.com


