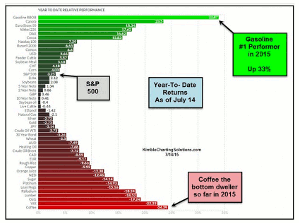
For traders and investors who subscribe to the notion of "Buying Low and Selling Higher,” Chris Kimble, of Kimble Charting Solutions, takes a technical look at the Year-to-Date best and worst performing assets in relation to the, so far, relatively quiet yearly performance of the S&P 500.
The S&P 500 has been pretty quiet so far this year, up just 3%. The same can’t be said for Gasoline or Coffee.
Do you believe in the idea of “Buying Low & Selling Higher?” This post today looks at the year-to-date best and worst performing assets.
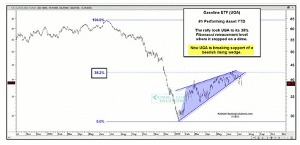
The chart below updates the current status of US Gasoline ETF UGA
The strong move up this year took UGA so far, stopped on a dime at the top of this rising wedge and its 38% Fibonacci retracement level. Of late, UGA has been soft, breaking below the bottom of the bearish rising wedge formation. Earlier this year Premium & Sector members bought UGA at the end of January and harvested gains after a nice rally.
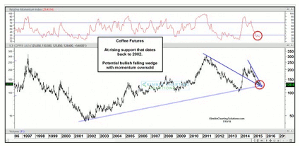
What does the weakest asset YTD look like?
Coffee Conditions in December of 2013: Coffee hit 12-year rising support, momentum was oversold, and few investors were bullish Coffee after it had declined almost 65% in two years. What happened next? Coffee doubled in 90-days.
Current Coffee Conditions: Coffee’s decline has taken it down to a rising support line that has been in play since 2002, it looks to have formed a bullish falling wedge with momentum oversold. Bullish opportunities look to be in play should Coffee buyers step forward and break overhead resistance.
Even though the S&P 500 has been quiet this year, many assets have had big moves, such as Gasoline. Did you realize that Crude Oil and the Yield on the 10-year note both rallied over 30% this year in short periods of time?
By Chris Kimble, Founder, Kimble Charting Solutions


