Corey Rosenbloom, of AfraidToTrade.com, takes to the charts to examine what’s going on with the stock of this once tech goliath—now downtrending—and to determine what the short-term future may be for this former high-flyer.
What’s going on with Apple (AAPL)?
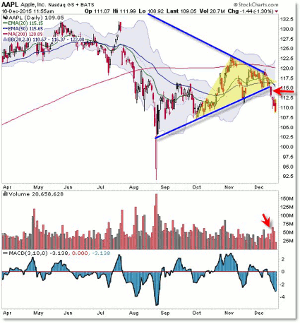
This week shares broke a key trend line support level, breaking out of a triangle pattern and giving us yet another sell-short (or sell) signal in an ongoing and confirmed new downtrend.
Let’s take a look at what’s going on and what the short-term future may be for this once high-flying name:
First, trends are defined by price and downtrends are marked by lower lows and lower highs.
Apple is downtrending on the daily chart and just broke under a key trend line support level at $115.00.
Note the highlighted triangle price pattern at this level along with the rising (lower) trend line.
Earlier, price shattered this key pivot point and volume surged as price broke lower.
This was a validation of the breakout, triggering a short-sell (or liquidate) signal that resulted in price falling to where we are now under $110.00 ($109 at the moment).
Weekly Perspective for a Broader View of What’s Going on:
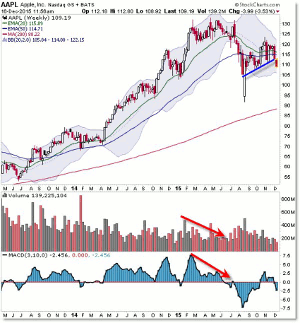
Apple (AAPL) peaked in a distribution pattern (divergences) above $130.00 per share.
From that multi-month peak, price collapsed mid-2015 toward $100.00 per share.
Price is possibly triggering another impulse sell signal or breakdown from key trend line support.
If so, look for price to travel lower toward $105 or even the $100 level again.
Apple in this pattern would not be a safe buy until (and unless) it gets back above the $110 and $115 levels.
By Corey Rosenbloom, CMT, Trader and Blogger, AfraidToTrade.com


