Corey Rosenbloom, of AfraidToTrade.com, takes a technical look at the daily and weekly charts for the stock of this on-demand streaming media provider and recommends swing traders focus their attention—and build trading strategies—off this pivot.
Will Netflix (NFLX) hold critical support and bounce higher to continue the uptrend?
Or perhaps will sellers win the battle, collapsing price to a new lower support target?
Let’s Plot the Price Course and Note the Trades to Take from Here in NFLX:
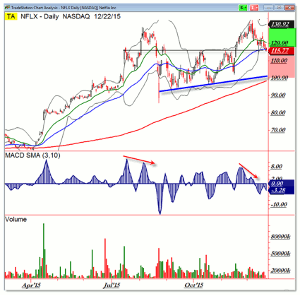
First, price remains (so far) in an uptrend and challenges a key support make or break pivot.
The $115.00 per share level is the confluence of the lower Bollinger band, 50-day EMA, and 50% Fibonacci retracement.
Either this level holds—resulting in a bullish rally up away from $115—or it doesn’t, collapsing price toward $100.
Your trade—if you’re willing to play the next immediate swing—would be the departure away from $115 here.
Note the lower rising support trend line and 200-day SMA near $100; the downside target.
Otherwise a bullish bounce play targets $120 then the prior high (uptrend continuation) into $130 per share.
Here’s a Clearer Perspective of the Weekly Chart and What May yet Be in Store:
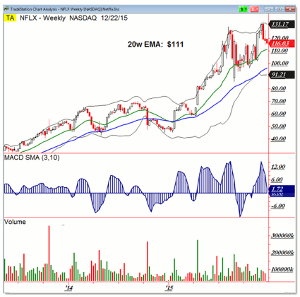
A quick glance at the weekly chart reminds us that price is in an ongoing uptrend.
However, we’re currently in a countertrend retracement swing down away from the upper Bollinger band.
Price is likely—according to the weekly chart—to trade down toward the rising 20-week EMA into $110.00.
If so, it suggests the daily chart support pivot ($115) will fail, opening the door to a sell swing $5.00 lower.
Note how the rising 20-week EMA has been a key target during the uptrend.
Focus your attention—and build trading strategies—right now off the $115 pivot.
By Corey Rosenbloom, CMT, Trader and Blogger, AfraidToTrade.com


