

An island top the week of May 1 would have a higher probability of leading to a bear trend, asserts Al Brooks, MD, who has traded full-time for 30 years and is the author of several books, in his weekly commentary.
Monthly S&P500 Emini futures candlestick chart:
Buy climax at measured move target
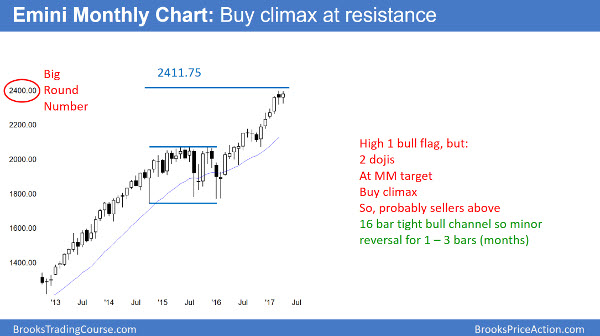
April was a pullback in a 16-bar bull trend. Yet, because it is a doji after a buy climax and at resistance, the odds are that there will be sellers not far above.
The monthly S&P500 Emini futures candlestick chart has a High 1 bull flag after a buy climax and at resistance. While April is a buy signal bar, it is a doji. Furthermore, last month was also a doji. In addition, this pullback is at a measured move target based on the 2014-2015 trading range. Finally, the 16-month bull channel was tight. It is therefore a buy climax.
Consequently, these factors make April a weak buy signal bar. As a result, a breakout above April’s high will probably fail to go very far before the Emini pulls back.
When a tight bull channel lasts a long time like this, bulls will buy the first reversal down. Therefore, the reversal will probably become a bull flag and not a bear trend. Yet, the pullback could last several bars. A 3-month pullback on the monthly chart could easily fall 150 points. It would therefore create a bear trend on the daily chart.
Weekly S&P500 Emini futures candlestick chart:
Extreme buy climax and 60% chance of 5% correction soon
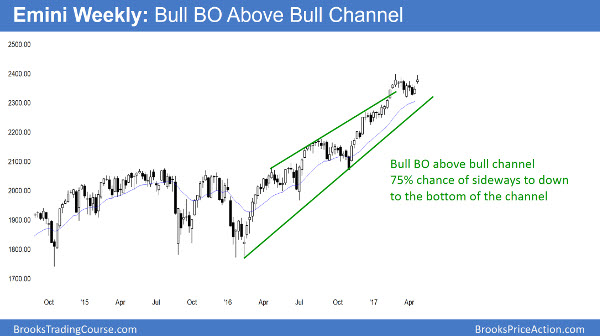
The weekly S&P500 Emini futures candlestick chart gapped above a 7-bar bull flag. Yet, last week’s breakout bar was a doji and it failed to break above the March high. Furthermore, the bull breakout above the bull channel should fail. Consequently, it should go sideways to down to test the bottom of the channel.
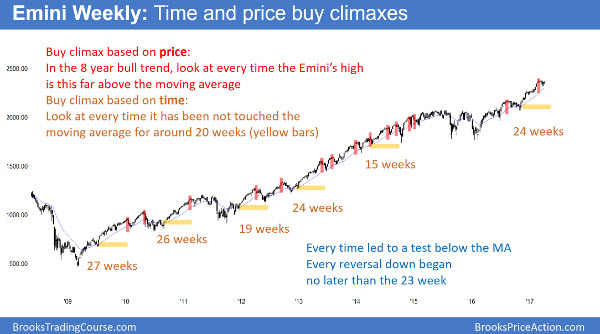
The weekly S&P500 Emini futures candlestick chart has not touched the 20-week exponential moving average for 24 weeks. This is therefore an extreme buy climax.
The weekly S&P500 Emini futures candlestick chart now has 24 consecutive bars completely above the moving average. This has happened only twice in the 8-year bull trend, and not in 6 years.
The weekly chart stayed above for 27 weeks in 2009 and 2010, and then 26 weeks in 2010 and 2011. These were the longest stretches in 14 years. In both cases, the pullback to the moving average began on the 23rd or 24th week. It took a few weeks to reach the moving average.
Correction will probably begin within 3 weeks
There have been many times in the current 8-year bull trend when the Emini stayed above the moving average for 15 or more bars. In every instance, it pulled back at least 20 points below the average. Furthermore, it fell about 50 points below several times. Finally, there is always the possibility of a much bigger correction. Yet, this is unlikely because the bull channels on the weekly and monthly charts are tight.
Consequently, a trader looking at the 20-week exponential moving average must conclude that a reversal will take place within a few weeks.
The moving average is currently around 2,310, which is about 90 points down from the March all-time high. In addition, the correction will probably fall at least 20-50 points below the average. Furthermore, the Emini never tested the December close of 2,233.25. Finally, May and June have a bearish bias.
Yale Hirsh reported in his Trader’s Almanac that, since 1950, the market fell 0.4% from May – October, but rallied 7.4% from November to April. If you invested $10,000 in 1949 from May – Oct, you would have $4,550. If you invested it from November to April, you would have $2,166,331.
As a result of these factors, the Emini has at least a 60% chance of a 5% correction before it gets much above the all-time high.
Good time to buy puts or put spreads
Since there is at least a 60% chance of a 100 point or more selloff over the next couple of months, the Trader’s Equation is unusually good for put buyers. For example, a trader could buy a June or July out of the money 235 SPY put for under $3. If the stock market falls 5%, that would be about 10 points in the SPY. The SPY might fall to 225. If so, each put would be worth more than $10. That would result in a $7 profit while the risk was only the $3 cost of the put.
It is unusual to have a 60% chance of making a reward that is twice as big as the risk. Therefore, this is a good opportunity for put buyers. Some traders would prefer to buy put spreads instead. That is also a good trade.
Weekly charts of many stocks have buy climaxes
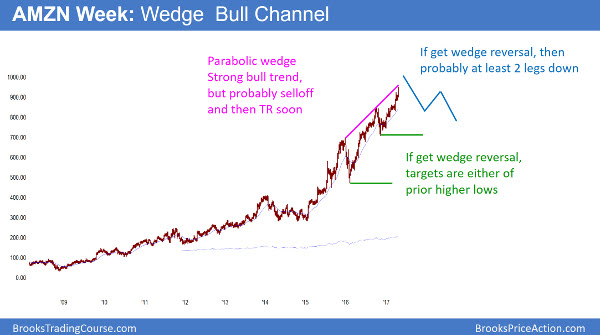
The weekly Amazon AMZN candlestick chart is forming a wedge top just below the 1,000 Big Round Number. The wedge has 3 climactic legs.
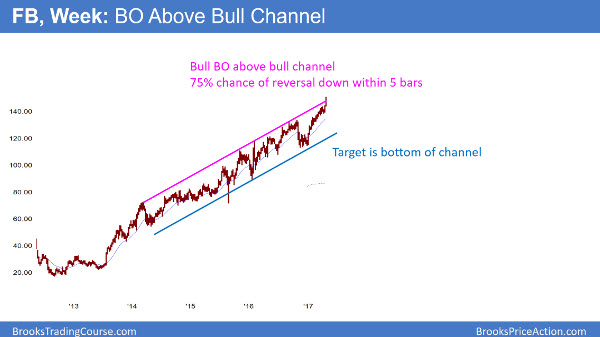
The weekly Facebook FB candlestick chart is breaking above its bull channel. It therefore has a 75% chance of a reversal down within 5 weeks.
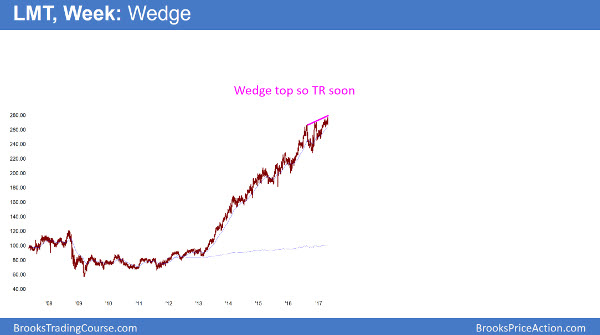
The weekly Lockheed Martin LMT candlestick chart is forming a wedge top. The odds favor a pullback and a trading range soon.
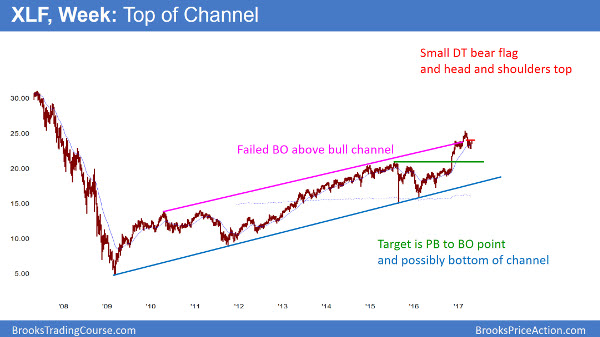
The weekly XLF candlestick chart is in a strong bull trend, and is breaking above a bull channel. The odds favor a reversal. There is also a head and shoulders top and a double top bear flag on the daily chart.
Most major stocks are in strong bull trends on the weekly chart. Yet, many are breaking above bull channels. Since there is only a 25% chance that a bull breakout above a bull channel will have strong follow-through buying after 5 weeks, these breakouts will probably fail. In addition, the reversal down usually reaches the bottom of the bull channel.
Many other stocks have wedge tops. In addition, the legs are very strong, and some are parabolic. While most do not yet have a reversal down, the upside is limited.
Risky to buy during buy climax
It is important for a trader to understand his goals. If he is an investor, he can buy at any time because he is confident the stock will be higher 1-5 years later. It is still better to buy pullbacks and not at the top of a strong bull trend.
If he is a trader, he is looking for fast money. He is willing to buy stocks that are rallying strongly based on the Greater Fools Theory. He is buying because he believes that there will be someone more foolish who will buy his stock from him at a higher price. This would result in a profitable trade.
Yet, this approach is risky because a reversal down can be very fast. This is because momentum trades are “crowded trades.” Most of the late buyers are buying simply because of the momentum up. They believe there will be enough follow-through momentum so that they can exit higher with a profit.
Once the momentum stops, they rush to exit. The result can be a big, fast reversal down. Consequently, the math is not great for traders buying late in a buy climax. Their probability of a profit is falling, and their stop is far away. Therefore, their risk/reward ratio is bad.
Daily S&P500 Emini futures candlestick chart:
Emini double top within 3 weeks, then 5% correction
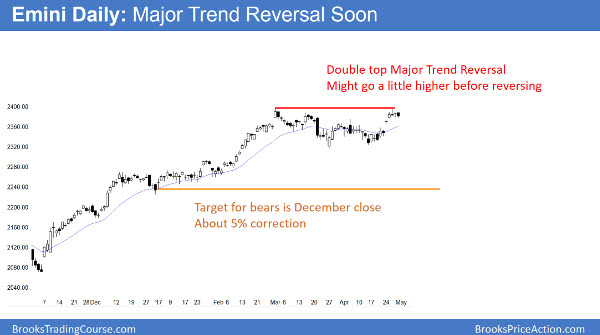
The daily S&P500 Emini futures candlestick chart turned down from just below the all-time high. This is a lower high major trend reversal.
The daily S&P500 Emini futures candlestick chart broke strongly above a 2-month bull flag last week (ending April 29). Yet, it failed to break above the March high. A reversal down would therefore be a lower high major trend reversal.
The bulls hope that the Emini breaks strongly to a new all-time high. Yet, the buy climax on the weekly chart makes a sustained rally from here unlikely.
Possible island top
If the Emini gaps down any day this week, it would create an island top with last week’s gaps up. In addition, if it gaps down on Monday (May 1), it would create an island top on the weekly chart, which is rare. While most island tops do not lead to reversals, there is an increased chance when other factors are present.
Here, the most important factor is the unusual buy climax on the weekly chart. Since there is at least a 60% chance of a 100-point correction starting within 3 weeks, an island top now would have a higher probability of leading to a bear trend. Furthermore, if there is a very big gap down, and that day becomes a big bear trend day closing on its low, it would likely be the start of the correction.


