

In his weekly report, Don Kaufman, founder of TheoTrade, explains the weak GDP report. Even as wages and benefits grow, consumer confidence is low with lower credit growth, lower spending and higher savings.
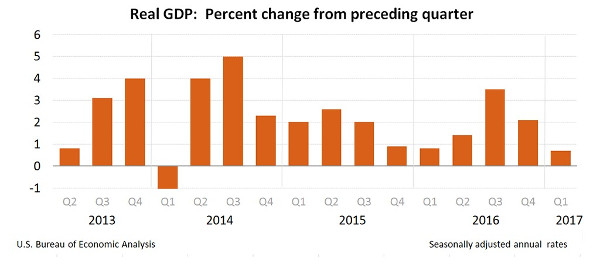
The Q1 GDP report came in at 0.7% growth. This was close to the 0.2% growth rate expected by the Atlanta Fed. Economists were expecting 1.0% growth, so it missed the consensus estimate. I expected growth to be between 1.0% and 1.5%. I think the takeaway from this report is less about how it did compared to estimates and more about how it is simply bad. It doesn’t matter what the economists expected.
Unless the economy is coming out of a recession, 0.7% growth will always be considered bad, barring a sharp deceleration in the growth in the labor force. The chart below shows how it was a weak report compared to the previous ones in this weak recovery.
Before I get into the analysis of this weak report, it’s important to recognize that this is only the advanced report. The advanced report compared to the latest report has an average revision of 1.1%. In theory, the current range for Q1 GDP is between -0.4% and 1.8%. This wide range makes looking at this one GDP report as the main conclusion to your macroeconomic analysis the wrong approach.
By the time the final revision comes out, investors have moved on to worrying about future quarters.
A second point to keep in mind is that saying Q1 data doesn’t matter because it’s always weak is not an argument.
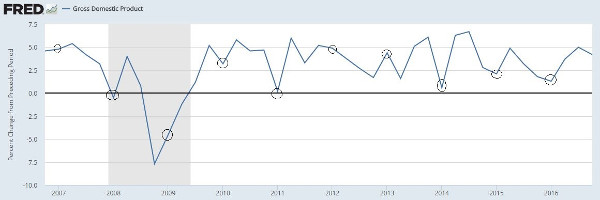
As you can see from the chart below, six out of the last ten Q1 GDP reports were the low points of the year (the circled points are Q1). It’s meaningless to say Q1 reports are always weak, since they aren’t. That’s a way to justify ignoring results. It’s fine to be bullish if you think the economy will accelerate, but it’s not helpful to be intellectually dishonest by doing mental math instead of looking at the data.
Part of the reason the GDP report was weak was because it was dragged down by declines in government spending on the state, local, and federal levels. That is a positive sign because I always consider government spending as temporary. The government usually uses borrowed money when it increases spending. Borrowed money simply subtracts potential growth from the future. If there was an increase in government spending while governments had balanced budgets, that wouldn’t be a negative. The other portions which dragged down GDP were a decline private inventory investment and an increase in imports.
Those declines were mostly expected especially since President Trump implemented a federal hiring freeze, ending on April 12 which is outside the Q1 reporting period. The factor which had decelerating growth is more important than the drags. The deceleration in personal consumption expenditures pushed growth lower. This is important because about two-thirds of economic growth is created by consumption.
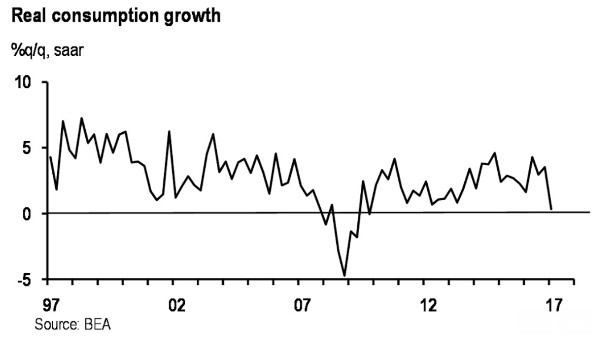
As you can see in the chart below, PCE growth was 0.3% which was the lowest since Q4 2009. This was close to the Atlanta Fed’s estimate for consumer spending to grow 0.1%. This means the conclusion I made previously from these estimates was accurate. The conclusion was that the consumer wasn’t being truthful in the confidence surveys. The present situation index was soaring, but the actual spending growth was weakening as evidenced by the retail bankruptcies and the negative same store sales that restaurants collectively reported.
One of the bull cases being promoted is that if PCE growth was average, the GDP growth would have been 2%. This is a ridiculous perspective because that’s like saying if the economy grew faster, the GDP growth would have been higher. Consumption growth is either decelerating because the consumer is running out of methods to borrow to spend money or it’s a blip on the radar which will revert higher based on strong wage growth.
The 2.5% decline in spending on motor vehicles pushed down durable goods expenditures. The popping of the bubble in the auto market won’t hurt the economy as much as the housing bubble burst, but when the economy is barely growing, anything can push it towards negative growth. Negative growth could catalyze a real recession where the debt cycle ends. Growth slightly below zero won’t be the worst of this next recession. The next recession will be worse than 2008 because of the size of the debt bubble.
As I mentioned, the bull case after analyzing this weak GDP report is that wages improved. The employment cost index grew at 0.8% which was the fastest growth rate since Q1 2008. Wages grew 0.8% and benefits grew 0.7%.
Real disposable income grew 1.0% which makes sense because of the increase in wages. The reason this increase in income didn’t push up PCE is either because of the increase in savings or because of the decline in credit growth. Personal savings as percentage of total income was 5.7% which increased from 5.5%.
This is the biggest divergence from the optimism shown in the consumer confidence reports. Even though consumers are saying they’re optimistic, they are putting the extra income they are making into savings. This makes sense because the workers haven’t gotten a pay increase when taking account rent expenses this cycle. They’re getting a bit of relief and plugging that into savings.
The consumer debt level is at a record; the consumer may be realizing that the debt will have to paid somehow, so it’s better to save than spend with reckless abandon.
Conclusion
As I expected, the Q1 GDP report came in closer to the Atlanta Fed’s estimate of 0.2% growth than the NY Fed’s estimate of 2.7% growth. GDP is the most important economic indicator. It shows how the economy is doing, but it’s not a predictive measure.
The takeaway from this report is that consumer spending growth is very weak. Credit growth will determine when the economy falls into a recession. Weakness in spending on autos was behind the weak Q1 durable goods orders.
This is a trend which will continue as the auto loan bubble bursts this year. The early estimates for Q2 GDP growth are not worth paying attention to because the data is scarce. The Q1 report is subject to wide revisions, so you can imagine how far off any estimates for Q2 will be.


