

The broad market (NYAD) did not measure up to the action in the S&P 500 May 5, which is a big change from the recent price behavior and a potential sign of weakness for the overall stock market, asserts Joe Duarte, MD. He’s traded, analyzed and written about the markets since 1990.
It’s a well-known Wall Street mantra: “sell in May, and go away.” But so far, May has been a pretty good month, at least if you look at the new high on the Standard & Poor’s 500 Index of Large Cap Stocks (SPX) delivered on May 5 and the generally robust momentum of the technology sector since the November 2016 bottom.
Yet, a potentially bothersome development on the New York Stock Exchange Advance Decline line (NYAD) on Friday caught my eye and is worth detailing.
Was That a Stealth Sell Signal?
I’ve been bullish on the stock market since the November bottom based on one indicator, the NYSE Advance Decline line, which has been moving steadily higher and correctly predicting higher stock prices even as the indexes have in many cases lagged.
But the action on Friday caught me by surprise and makes me wonder if the market isn’t slowly building up to a meaningful decline and this isn’t the first stealthy sign of something worse to come.
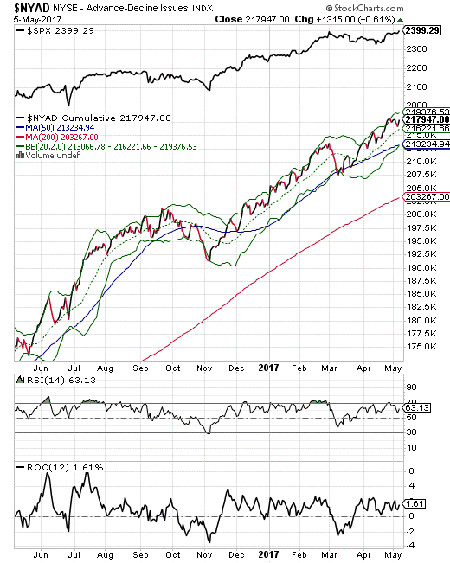
As the chart shows the S&P 500 (Upper panel) made a new high, while the NYAD did not make a new high. Now, I don’t want to sound alarmist here. For one thing, there were over 1300 more advancing stocks than declining stocks on Friday, which is a great day for the bulls.
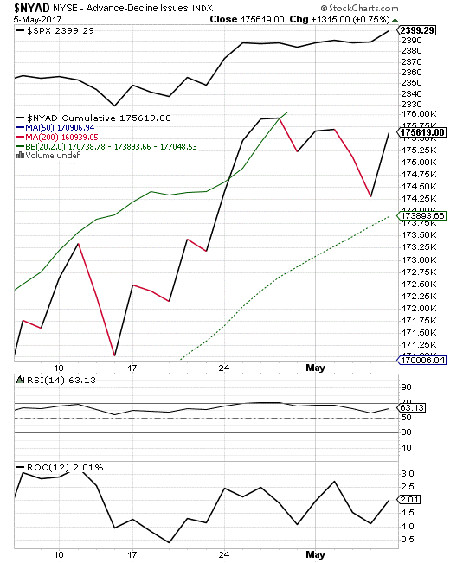
And overall, the NYAD remains in an uptrend. But, as you can see in the enlarged chart below, the NYAD did not confirm the new high for the index on Friday, which is troublesome to technical analysts.
As a traditionalist, I like to think of the market’s trend as the sum of the personalities of the underlying stocks. Similarly, if the stock market is an army, the S&P 500 is the command center which houses the generals and the NYAD represents the troops on the front line.
In a war, you want the troops on the front line to be doing well, even if the generals aren’t doing so well. This, of course, is because wars are won in the trenches, not in the posh command centers. Moreover, history shows that in many cases it’s a more bullish scenario if the indexes move sideways while the NYAD continues to make new highs, as it signals a strong underlying market, or front-line force. This is what’s been happening over the last few months. So, any potential change in the market’s behavior suggests a change in its personality, and a potential change in the trend.
A Dissonant Note
Let me explain this bothersome blip on an indicator chart in more detail. Traditional technical analysis requires that every new high in the S&P 500 be accompanied by a new high in the advance decline line. When this happens the index and the broad market are in synch or convergent, or in harmony, which is bullish.
But if you take Friday’s action on its own merits, the front-line army showed some weakness while the generals showed more strength. This is what is known as a divergence, a disagreement or sign of dissonance/dysfunction, between the two branches of the army, SPX and NYAD.
Another way to look at it is this: the broad market (NYAD) did not measure up to the action in the S&P 500, which is a big change from the price behavior of the past five months and a potential sign of weakness for the overall stock market. In other words, the front-line troops may be getting tired. And as history shows, an army with no front line will lose the war.
No doubt, technical analysis is not perfect. And there is always some wiggle room in any stock market related analysis. Thus, this potential divergence could well blow over if the market has a few good days and the NYAD makes new highs along the way. But if this type of market action continues, it may be a good idea to make some decisions about winners and losers.


