

Don’t worry about low VIX levels, asserts Marvin Appel, MD, PhD, and wait for additional buy signals before chasing the rally in foreign stocks. He’s president of Signalert Asset Management LLC.
State of the Market: The S&P 500 Index has stalled after touching a record high, barely above its March 1 close. Our models remain overall neutral-positive despite one of our indicators switching from a buy to a sell signal. Even though the market may face near term risks, the intermediate-term trend should remain overall sideways at worst, with downside risk limited to a retest of the April lows around 2330.
The S&P 500 Index Option Implied Volatility Index (VIX) touched record lows, recently closing below 10%. (See chart.) The historical average is 20%, which represents the annualized volatility that the S&P 500 Index would have to display to make current options prices fairly valued.
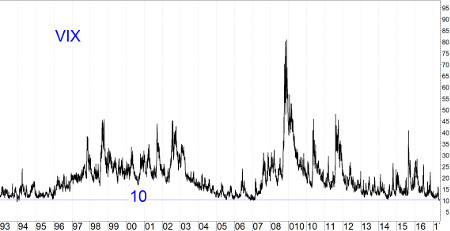
Closes below 10% have happened only eleven times in the more than 6100 trading days since VIX was introduced in January 1993.
VIX is called the fear gauge, since options are priced in expectation of high volatility when investors are scared, and low VIX is sometimes viewed as a sign of complacency. But historically, the stock market has done better when VIX was below average than when it was above, and the lowest VIX readings have been good times to hold stocks. So, don’t let low levels of VIX worry you. Although I cannot guarantee anything for the future, it should be much more fruitful to wait until our indicators generate sell signals than to sell just because VIX is so low.
Update on European equity ETFs
Recently, I recommended foreign equity ETFs as long-term holdings. Apparently, I am far from the only one who feels this way. On May 10, the Wall Street Journal reported that investors have pulled $22 billion from US equity ETFs and mutual funds in the past seven weeks, and added $21 billion to foreign equity ETFs and mutual funds.
The iShares Europe 350 Index ETF (IEV) broke out from $41.80 just before the final round of the French presidential election last Sunday (May 7). It was a case of buy on the rumor, sell on the news: Following the strong but expected victory by the pro-globalist center/left candidate over the right-wing populist, IEV pulled back by about 1%. However, at $44.43 IEV is still far above the $41.80 level from which it broke out.
I recommend waiting for additional buy signals before chasing the rally in foreign stocks.
S&P 500 looks to remain in a sideways trend
Meanwhile, the S&P 500 Index recovered from its early April losses only to stall in the area of its March 1 high. The chart to the right shows the S&P 500 SPDR (SPY) having trouble breaking through 240. Market breadth has also leveled off in the past two weeks, at a record high like price. MACD is on a buy signal, although one that is unconfirmed by a double rising bottom or positive divergence.
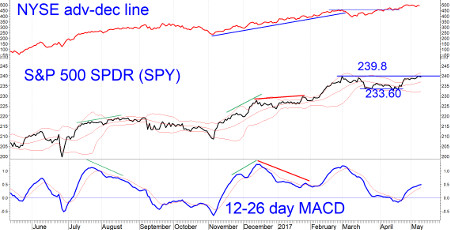
On the topic of market breadth, one sometimes hears that the advance-decline line is contaminated by non-equity issues such as preferred stocks and closed-end funds that comprise 40% of NYSE issues. These non-equity issues are particularly sensitive to interest rates. Tom McClellan addressed this in a report March 24, 2017. His conclusion is that the advance-decline line has been more informative than price alone only when the full range of issues is included. Using an advance-decline line constructed from just common stocks did not provide any information beyond what you could learn from analyzing the major indexes.
The implication is that it is reassuring that market breadth reached new highs late in April even though SPY itself appears stuck in the mud for now.
Subscribe to investment newsletter Systems and Forecasts here…


