

Many traders want higher probability. They therefore must wait for a strong breakout up or down before entering, asserts Al Brooks, MD, who has traded for 30 years and has written several books.
Monthly S&P500 Emini futures candlestick chart:
Weak entry bar after 1 bar bull flag
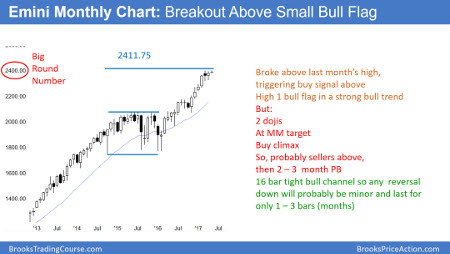
The monthly S&P500 Emini futures candlestick chart had a High 1 bull flag in April. May traded above the April high, and therefore triggered the buy signal.
The monthly S&P500 Emini futures candlestick chart is a small doji bar so far this month. Because it traded above the April high and April was a one bar High 1 bull flag, it triggered a buy signal. Yet, a High 1 bull flag after a 6-week buy climax and at the resistance of a measured move is a low probability trade. Usually, the Emini rallies for 1 or 2 bars and then pulls back for several bars. Therefore, this breakout will probably reverse down this month or in June.
Since the 17-month rally is in a tight bull channel, it is very strong. Therefore, bulls will buy the first selloff. Hence, it will probably become a 2 to 3-month bull flag instead of the start of a bear trend. However, a 3-month bull flag on the monthly chart could easily fall 150 points from the high. This would therefore be enough for the daily chart to be in a 3-month bear trend.
Final bull flag
The Emini is at the measured move up from its 2014–2015 trading range. Since that range formed late in an 8-year bull trend, it will probably be the final bull flag. Consequently, the upside over the next year is probably not great. The Emini will probably go mostly sideways for a year or so and begin to form a top.
The top might be as high as 2500. Then, the Emini will probably get pulled back into the 2014–2015 trading range. This process could take 20 or more bars. Since this is a monthly chart, it might take 2 to 3 years do test back down to the 1800 bottom of that 2-year final bull flag.
Weekly S&P500 Emini futures candlestick chart:
Extreme buy climax
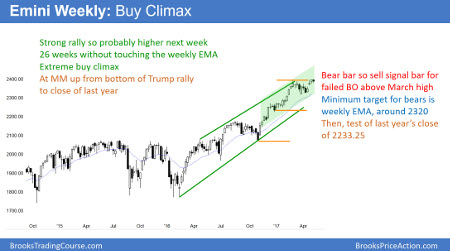
The weekly S&P500 Emini futures candlestick chart had a bear trend bar this week (ending May 12). It is therefore a sell signal bar for a small higher high major trend reversal.
The weekly S&P500 Emini futures candlestick chart has not touched its 20-week exponential moving average in 26 weeks. When a bar is completely above the moving average, there is a gap between its low and the moving average. I call that a bull gap bar.
In the 8-year bull trend, the longest series of bull gap bars was 27 weeks. Furthermore, that was at the start of a bull trend. Since trends often begin with a strong breakout, they are often strongest early on.
Yet, this current rally is just as strong. Furthermore, that 27 weeks of gap bars began to turn down at the 23rd week. Since this week had a bear body, it might be the start of the reversal down. Because it is far above the moving average, it might need several weeks to get there. Therefore, this stretch will probably be the longest in the 8-year bull trend.
Longest series of gap bars was after the 2003 bear trend low
There has only been one time in the 18-year history of the Emini when the weekly chart stayed above its average for more than 27 weeks. That happened in 2003 after a huge bear trend. The reversal up was very strong and the Emini stayed above the average for about 50 weeks.
Yet, there were two pullbacks around 17 weeks and 25 weeks that got very close to the average. Hence, they were probably enough to relieve the buy climax, and this allowed the rally to continue. Furthermore, that was after a strong reversal up from an extreme sell climax, and therefore more likely to be a very strong rally.
That is very different from the current situation. Now, the Emini is at the end of an 8-year bull trend, not the beginning. Therefore, it is likely to be not as strong as the start of a bull trend. Hence, this 26-week stretch of gap bars is probably an exhaustive move instead of a measuring gap for the start of a new swing up.
Island top?
If the Emini gaps down on Monday (May 15), it will create a 3 week island top. In addition, if next week then becomes a big bear trend bar, the selloff to the weekly moving average will probably have begun. While most island tops and bottoms form in trading ranges and are no more important than any other minor reversal, this one is different. That is because it would be forming in an extremely overbought market. It therefore would have a higher probability of beginning a swing down for about 10 bars.
Ten bars on the weekly chart is about 2 months. That is consistent with the monthly chart. The bull trend is so strong on the monthly chart that the bulls will look to buy a 2 – 3 bar (month) pullback.
If Monday gaps down, but then rallies to close the gap, there would no longer be an island top. Consequently, the Emini might go sideways to up more before falling to the weekly moving average.
Daily S&P500 Emini futures candlestick chart
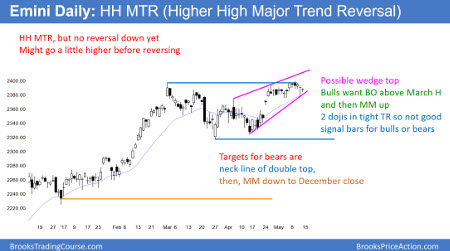
The daily S&P500 Emini futures candlestick chart has been in a tight trading range for 3 weeks. This week made a new all-time high, but pulled back from 2400.00. It is trying to reverse up from the moving average and then break above the 2400 Big Round Number.
The daily S&P500 Emini futures candlestick chart has had 2 legs up from the March 27 low. Furthermore, the bull channel has a wedge shape. It is therefore likely to have a third push up, which would complete the wedge. Since the weekly chart is likely to begin a 100 to 150-point correction within the next 3 weeks, a wedge top on the daily chart would be a good sell setup.
The bulls need a 1 to 2-week rally to the top of the wedge channel, and then a good sell signal bar. This would create a wedge higher high major trend reversal.
Most good looking major trend reversal tops have a 40% chance of a swing down.
The probability would be higher here because of the extreme buy climax on the weekly chart. Yet, betting that any one top is the final top is never more than 50% certain. Therefore, major reversals often need 2 – 3 reversal attempts before one finally succeeds.
Rally to 2500?
Can the current rally continue up to 2500 without pulling back to the weekly moving average? Even when things are unlikely, they are still at least 30 – 40% likely. The Emini is in a strong bull trend on all time frames. Therefore, despite the extreme buy climax on the weekly chart, there is at least a 30% chance that the Emini will rally 100 points to 2500 before falling 100 points to below the weekly moving average.
Let’s say that the probability is 40% that we will see a 100-point rally before a 100-point selloff.
Should a trader buy or sell? The risk and reward is 100 points for both the bulls and bears. Yet, the probability is 60% for the bears. That means that the bears have a strong Trader’s Equation. Hence, the math favors the bears. Therefore, if a trader were forced to either buy or sell here, the correct choice would be to sell.
Many traders want higher probability. They therefore must wait for a strong breakout up or down before entering. The price they pay for their higher probability is a worse risk/reward ratio. The stop is further so the risk is greater. In addition, there is less profit remaining in the trade. It is still a logical choice.


