

It is not possible to know exactly when this small correction will begin, asserts Troy Bombardia. The US stock market cannot rally much further or much longer without making a small correction. He’s a hedge fund manager with Troubadour Capital.
It’s likely that the S&P 500 will make a small correction (6-10%) very soon. Let’s look at the bearish case from the technicals, fundamentals, and correlation perspectives (oil and the energy sector).
Fundamentals
The fundamentals of the US stock market are purely based on the state of the domestic economy. The states of foreign economies do not impact the S&P 500 because:
1. The US is a relatively closed economy (unlike the economies of Germany, China, Singapore, Australia, etc).
2. Less than 30% of revenues for S&P 500 companies come from overseas, which means that a small downturn in a foreign economy will have a negligible impact on US corporate revenues and earnings.
The fundamentals of the domestic economy are strong right now. Indicators such as Retail Sales, Housing Starts, New Home Sales, the unemployment rate, Initial Claims etc. are all improving. History shows that the stock market will not enter into a bear market if the economy is improving.
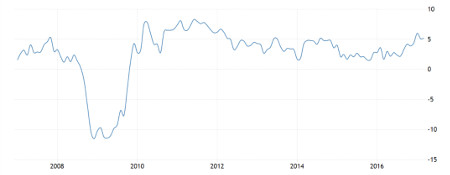
This chart for Retail Sales shows year-over-year growth.
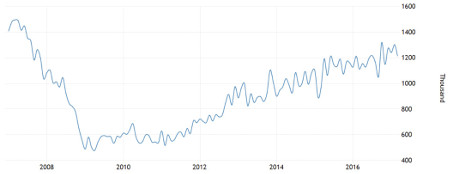
The following chart shows that housing starts are growing strongly.
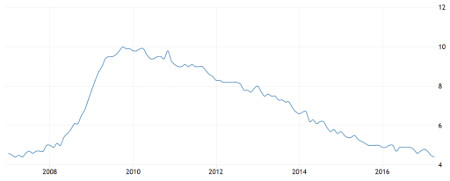
The following chart shows that the unemployment rate is falling. The unemployment rate always rises before a recession starts.
In addition, forward expected earnings for the S&P 500 have risen 3% year-to-date. If this trend continues, the S&P will experience one of the strongest years of earnings growth since 2009! This surge in earnings is primarily attributed to rising energy prices (aiding energy sector earnings) and rising interest rates (aiding financial sector earnings).
The following data is for forward 12 month EPS (S&P 500).
released on – 4/05/2017
12 month EPS – 136.9
released on – 27/04/2017
12 month EPS – 136.3
released on – 20/04/2017
12 month EPS – 135.9
released on – 13/04/2017
12 month EPS – 135.8
released on – 6/04/2017
12 month EPS – 135.1
released on – 30/03/2017
12 month EPS – 134.9
released on – 23/03/2017
12 month EPS – 134.5
released on – 16/03/2017
12 month EPS – 134.3
released on – 9/03/2017
12 month EPS – 134
released on – 2/03/2017
12 month EPS – 133.8
released on – 23/02/2017
12 month EPS – 133.8
released on – 16/02/2017
12 month EPS – 133.5
released on – 9/02/2017
12 month EPS – 133.4
released on – 2/02/2017
12 month EPS – 133.4
released on – 26/01/2017
12 month EPS – 133.9
released on – 19/01/2017
12 month EPS – 133.7
released on – 12/01/2017
12 month EPS – 133.3
released on – 5/01/2017
12 month EPS – 132.9
released on – 29/12/2016
12 month EPS – 132.7
released on – 22/12/2016
12 month EPS – 132.4
released on – 15/12/2016
12 month EPS – 132.2
released on – 8/12/2016
12 month EPS – 131.8
released on – 1/12/2016
12 month EPS – 131.57
released on – 24/11/2016
12 month EPS – 131.23
released on – 17/11/2016
12 month EPS – 130.9
released on – 10/11/2016
12 month EPS – 130.69
released on – 3/11/2016
12 month EPS – 130.49
released on – 27/10/2016
12 month EPS – 130.39
released on – 20/10/2016
12 month EPS – 130.16
released on – 13/10/2016
12 month EPS – 129.91
released on – 6/10/2016
12 month EPS – 129.98
released on – 29/09/2016
12 month EPS – 129.45
released on – 22/09/2016
12 month EPS – 129.2
released on – 15/09/2016
12 month EPS – 129.3
released on – 8/09/2016
12 month EPS – 129.29
released on – 1/09/2016
12 month EPS – 128.93
released on – 25/08/2016
12 month EPS – 128.65
released on – 18/08/2016
12 month EPS – 128.3
released on – 11/08/2016
12 month EPS – 127.99
released on – 4/08/2016
12 month EPS – 127.87
released on – 28/07/2016
12 month EPS – 127.68
released on – 21/07/2016
12 month EPS – 127.39
released on – 14/07/2016
12 month EPS – 127.05
released on – 7/07/2016
12 month EPS – 126.97
released on – 30/06/2016
12 month EPS – 126.76
released on – 23/06/2016
12 month EPS – 126.58
released on – 16/06/2016
12 month EPS – 126.47
released on – 9/06/2016
12 month EPS – 126.21
released on – 2/06/2016
12 month EPS – 125.86
released on – 26/05/2016
12 month EPS – 125.49
released on – 19/05/2016
12 month EPS – 125.19
released on – 12/05/2016
12 month EPS – 124.59
released on – 5/05/2016
12 month EPS – 124.37
released on – 28/04/2016
12 month EPS – 123.95
released on – 21/04/2016
12 month EPS – 124.53
released on – 14/04/2016
12 month EPS – 124.39
released on – 7/04/2016
12 month EPS – 124.23
released on – 31/03/2016
12 month EPS – 124.13
released on – 24/03/2016
12 month EPS – 123.99
released on – 17/03/2016
12 month EPS – 123.96
released on – 10/03/2016
12 month EPS – 123.87
released on – 3/03/2016
12 month EPS – 123.82
released on – 25/02/2016
12 month EPS – 123.95
released on – 18/02/2016
12 month EPS – 124.09
released on – 11/02/2016
12 month EPS – 123.97
released on – 4/02/2016
12 month EPS – 124.33
released on – 28/01/2016
12 month EPS – 124.6
released on – 21/01/2016
12 month EPS – 125.66
released on – 14/01/2016
12 month EPS – 126.18
released on – 7/01/2016
12 month EPS – 126.92
However, the improving economy does not mean that the S&P cannot make a small correction right now. Many small corrections happen purely for technical reasons, even when the economy’s fundamentals and corporate earnings are improving.
Technical reason for a small correction
The longest rally in history without a small correction lasted 14 months (in 1995). By June 2017, the current rally will be the second longest rally in 50 years. Assuming that the record is not broken, this means that the S&P will start a correction before this summer is over.
In fact, we can already see that the S&P is being weighed down by this technical extreme (in terms of time). Despite a very strong Q1 2017 earnings season, the S&P was completely unable to make a meaningful new all-time high.
Correlation
Most small corrections that happen for technical reasons tend to coincide with bearish themes. Right now, the main bearish theme is “falling oil prices.” Oil prices only impact the S&P through the energy sector. Oil’s price 1 year ago was $50, so if oil remains at $45 or falls lower, then earnings growth for the energy sector will fall.
This will put downward pressure on the energy sector, which will put similar downward pressure on the S&P. Energy sector earnings grew the most last quarter. Without the energy sector’s contribution, the S&P’s earnings growth rate will fall.
In addition, lower oil prices will cause inflation to decline from approximately 2% to 1.5-1.6%. Since there has been a strong correlation between inflation and interest rates over the past year, lower oil prices will also drive interest rates down temporarily.
Falling interest rates put downwards pressure on financial sector earnings. The financial sector was one of the top 3 sectors that contributed to a great Q1 for the S&P 500. Without this sector’s contribution, the S&P earnings growth rate will fall.
In addition, falling oil prices brings back bearish memories of January 2016 when oil crashed below $30 and the S&P fell 15%. So, if oil prices fall to $40, those bad memories will spook investors.
It is very possible that oil will to fall to $40 in the next few months. Despite the OPEC oil production cut, US oil production is soaring. In the short term, an increased supply will put downwards pressure on oil prices.
Bottom line
It is not possible to know exactly when this small correction will begin. Perhaps today, perhaps next week, or perhaps in June. But one thing is certain. The US stock market cannot rally much further or much longer without making a small correction.


