Look to the market being at 2600SPX in 2018 or potentially even higher, and then consider cashing in your chips in a big way asserts Avi Gilburt, a widely-followed Elliott Wave technical analyst.
This past week (ending May 26), the market moved into a larger resistance region to which I have been pointing for months, between 2410-2425. It will make its decision within this region as to whether it heads to 2500SPX directly from here, or loops down one more time to 2330SPX.
Anecdotal and other sentiment indications
Not long after we began calling for a pullback/consolidation in the stock market on March 1, I wrote an article wherein I pointed out that something very important is finally happening in the stock market:
However, recently, I am witnessing something quite notable in the stock market. I am starting to see some former bears beginning to embrace this stock market rally. In fact, someone who was fighting this rally tooth and nail for quite some time noted this past week that the traditional causes of recessions…are nowhere on the horizon.
Since I read that, I have been trying to remember where I have heard something similar and I found it. In a paper written by Professor Hernan Cortes Douglas, former Luksic Scholar at Harvard University, former Deputy Research Administrator at the World Bank, and former Senior Economist at the IMF, he noted the following regarding those engaged in "fundamental" analysis for predictive purposes:
“The historical data says that they cannot succeed; financial markets never collapse when things look bad. In fact, quite the contrary is true. Before contractions begin, macroeconomic flows always look fine. That is why the vast majority of economists always proclaim the economy to be in excellent health just before it swoons. Despite these failures, indeed despite repeating almost precisely those failures, economists have continued to pore over the same macroeconomic fundamentals for clues to the future. If the conventional macroeconomic approach is useless even in retrospect, if it cannot explain or understand an outcome when we know what it is, has it a prayer of doing so when the goal is assessing the future?”
So, in typical fashion, over the last several weeks I have seen several more former bears come on over to the dark side, with one noting: I've been bearish or skeptical about the stock market for the past couple of years, but now I'm bullish on stocks.
In the past, I have noted how former bears begin to turn bullish through the heart of a 3rd wave rally. This is what Robert Prechter has called the point of recognition. It is when the market recognizes that we are in a break out mode, and begins to turn from their former bearish state towards bullishness. And, the farther we travel from the point of recognition, the more the market turns towards bullish sentiment. It is absolutely necessary for this to occur so that sentiment can swing towards a high degree of bullishness, which will then mark a major market top.
And, as I have noted in prior articles, we have begun to see this swing towards bullishness once we moved through the heart of that 3rd wave within 2017. In fact, this is what I noted in the prior article discussing this sentiment change in the market:
This is quite typical of how the market reacts. Remember, most people do not turn bullish at the lows, but rather, bullishness develops as the market rallies higher and higher, with the most extreme levels of bullishness being evident near major market tops. This is simply how human nature works within the herd, and being able to track market sentiment allows you to rise above it rather than become a part of it.
What is most amazing, is that those who are presenting a bullish thesis about the market now are doing so because they believe the fundamentals are now supportive of the bull market.
So, again, I must ask a question to those who siphon information through an intellectually honest prism: The fundamentals did not support the bull-market thesis at the last market consolidation low region in February of 2016, but, rather, were suggestive of what most viewed as an impending crash. Yet, when the market is 35% higher, the fundamentals are now starting to support the bullish thesis? Does anyone else see anything wrong with this? And, I have written why this occurs from a fundamental perspective in past articles.
I am sorry to point this out again, but following these fundamental perspectives will cause you to act like sheep being led to the slaughter. I can assure you that the fundamentals will only look better and better over the next year as we rise to strike the highs which will set up a 15-20% correction, just as all the final sheep are piling in.
And, not only will article writers proclaim their bullish perspectives from the hill tops based upon the fundamentals, you will see the last vestiges of the perma-bears being raked over the coals in their comment section, as they continually point out why the market will crash, just as they have for years. When this occurs, look to the market being at 2600SPX in 2018 or potentially even higher, and then consider cashing in your chips in a big way. Until that happens, we will likely have further highs to attain in 2018, even as we pull back again to 2300 later this year.
Price pattern sentiment indications and expectations
For quite some time, we have been looking for the market to exceed 2500SPX. Even when many were looking for the market to crash back in early 2016, we still maintained our expectation. And, we have no reason to change that expectation at this point in time.
The only question we face today is if we are heading there directly at this time, or if we have one more strong drop before the rally to 2500SPX. And, the answer lies within the resistance region we have been pointing towards over the last several months, which resides between 2410-2425SPX.
This past week, the market moved into this resistance region, and how it reacts from this region will tell us if we are taking the direct route to 2500SPX or if we revisit the 2330SPX region before the run to 2500SPX begins in earnest. Currently, support resides in the 2400SPX region. Should we see a strong drop below 2400SPX, it opens a trap door which can allow us to revisit the 2330SPX region and the drop can be fast and furious.
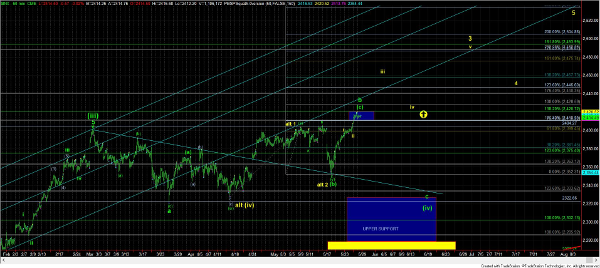
However, if the market is able to continue to melt up through this resistance region, and follow through strongly over 2428SPX, then it signals we are rallying to 2500SPX sooner rather than later, the path for which is represented by the yellow wave count on the attached 60-minute chart.
In the bigger picture, once we complete the pattern over the 2500SPX region, I am going to expect another multi-month consolidation/pullback down towards the 2300SPX region. And, as long as that support region holds, the market will likely set up to rally to the 2600SPX region next, but that is not likely going to be seen until 2018. But, that is the final rally we will likely see before we set up for a 15-20% correction in the market which will take us into 2019.
See the chart illustrating the wave count on the S&P 500 here.
Subscribe to Elliott Wave Trader here