

Trading in and out of bitcoin is risky and difficult. My plan is to buy a monthly allotment and suspend my purchases when the price gets out of control. Any asset that rises parabolically will have a large crash, asserts Don Kaufman, Co-founder of TheoTrade.
The latest report from the Treasury Department and the Office of Management and Budget is that the debt ceiling will be hit late in the summer. The CBO previously said the debt ceiling would be hit in the fall, so the deadline has moved up.
This is bad news for the stock market and should heighten volatility in August as the possibilities are debated. Late August is a time when volume is down because traders go on vacation, so we might see greater volatility than if it occurred in September. The competing factions will be moderate Republicans and the president who want a clean bill to pass, the House Freedom Caucus which wants spending cuts, and the Democrats who feel emboldened. In the last budget deal, the Democrats were pushing for a clean bill. They might agree with the president philosophically, but it’s tough to see this agreement going amicably without any stress. I think the debt ceiling will be raised, but the theatrics will affect the market.
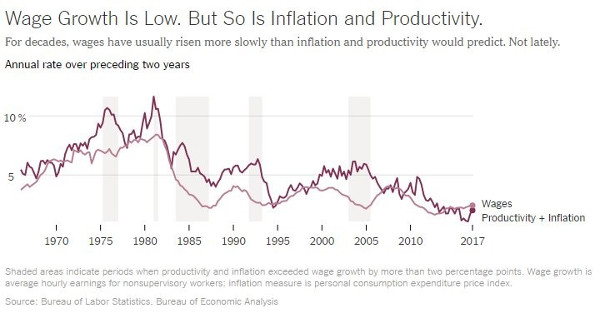
The Federal Reserve is raising interest rates despite the declining inflation rate because it thinks wage inflation is about to increase. The Fed bases this projection on low jobless claims which had its 4-week moving average just hit a 44-year low. However, as you can see from the chart below, wage growth is increasing faster than productivity growth plus inflation. It’s a rare feat for wage growth to speed past them. This means wage growth could slow in the next few months. Inflation has been declining lately which could further pressure wage growth. This explanation provides an alternate way of viewing the wage inflation dynamic because clearly low unemployment isn’t driving wage growth. The Fed continues to hold onto that projection even though it hasn’t come to fruition for several quarters.
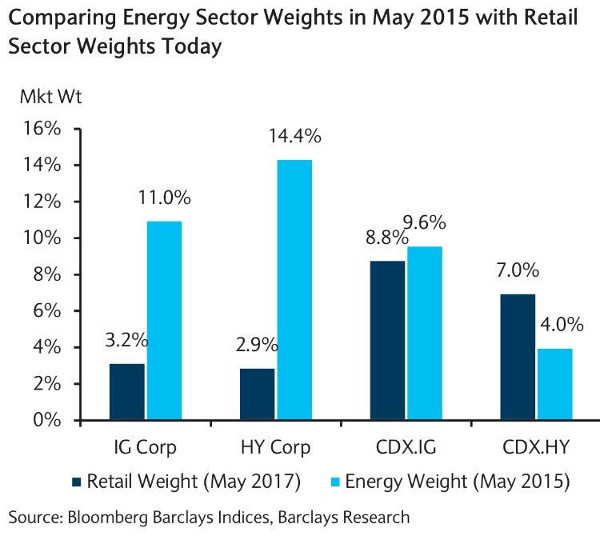
In early 2016, the oil market was able to make the credit cycle look bad enough so that it appeared the economy was headed for a recession. The recovery rates fell to record lows as oil and mining firms couldn’t pay back any of their debts with their asset bases declining so quickly. With the commodity falling, there was no hope to repay the lenders. As you can see from the chart below, the energy sector made up 14.4% of the high yield debt market in May 2015. Frackers’ strategy relies on cheap debt to drill for oil.
The latest industry to come under intense scrutiny is retail as the brick and mortar stores without an online strategy have failed miserably. Pricing is very important with online retail and quality is less important. Millennial shoppers like to wear one look for Instagram and then discard it. It’s better to buy cheaply if you’re doing that. Online shoppers can’t feel the quality of the fabrics. All they can see is price. Therefore, they go with the cheapest options. It’s clear some of these retailers will go bankrupt.
Luckily for the debt market, the retail weight of the high yield debt market in May 2017 is only 2.9%. Problems with retail won’t be able to cause the credit cycle to look like it’s unwinding. It couldn’t even get the consumer discretionary sector to have negative earnings growth in Q1.
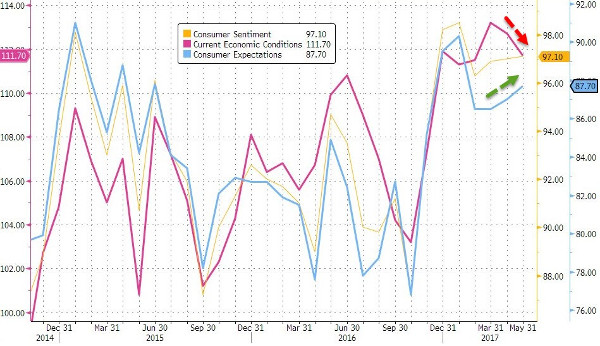
I have espoused the thesis that soft data would weaken as people realized that the economy was still weak and President Trump doesn’t have any magic which can change that. The tax cuts and regulatory reform will take a few quarters to be executed. I figured many business people and consumers would lose hope in the economy. While the soft data has come down, the consumer sentiment reports have remained high. The University of Michigan’s May consumer sentiment survey came in at 97.10. That was below the expectations for 97.5. It’s almost exactly at the December to May average which is 97.3. As you can see, the current economic conditions index fell and the consumer expectations index rose. Overall, it was a solid report.
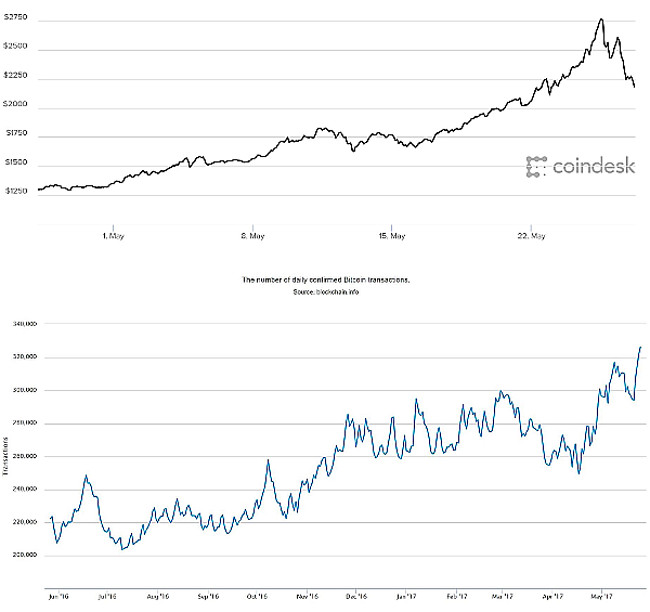
On a final note, bitcoin has been on a roller coaster ride in the past month. As you can see from the chart below, bitcoin has rallied from about $1300 to above $2800 before falling to near $2100. Bitcoin has done so well, it made it to the front page of CNBC.com. As someone who knows about bitcoin, I have been contacted by a few friends asking about it because it has been gaining attention. That’s usually the sign of a top.
The chart below the price of bitcoin shows the number of bitcoin transactions. This is my guide to where the price of the cryptocurrency should be. Since May 1, the number of transactions using bitcoin is up about 9%. That would be a reasonable rally. The doubling of the price is due to excess speculation. Buying bitcoin at these levels, even for the long-term, is risky at these prices.
The volatility in bitcoin has brought out the naysayers who say it will collapse and is worthless. Even though many of these permabears know little about bitcoin, they get a lot of attention when they talk about it, just like when predictors make headlines with calls for a large correction in the S&P 500. I haven’t changed my mind about bitcoin because of these swings.
Bitcoin has always been volatile. It’s best to buy the dips and stop buying when it gets too high. I’d look to get in close to $1,000.
Conclusion
It’s common sense that there is excessive froth with bitcoin. The price will correct when people who bought it below $500 decide to take profits. Many people claim to want to own bitcoin for the long haul, but eventually some of these long-term holders will sell when the price gets to a certain point. Trading in and out of bitcoin is risky and difficult. My plan is to buy a monthly allotment and suspend my purchases when the price gets out of control. Any asset that rises parabolically will have a large crash.


