

Both Amazon (AMZN) and Alphabet (GOOGL) can pull back at any time. That would probably come with a pullback in the Emini as well, asserts Al Brooks, MD, in his weekend Emini update.
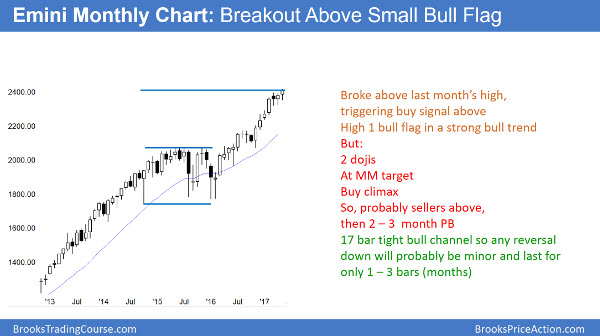
The monthly S&P500 Emini futures candlestick chart has 2 trading days left in May. May is a bull entry bar after last month’s High 1 bull flag. Yet, it is around a measured move up from the 2014–2015 trading range. Furthermore, it had a 4 month buy climax that began in November. A High 1 bull flag after a buy climax and at a measured move target usually only rallies for only 1–2 bars before pulling back.
The monthly S&P500 Emini futures candlestick chart has been in a bull trend for 8 years. The bull trend accelerated in November. However, the rally might be a buy vacuum test of the measured move up from the 2014–2015 trading range. There is no top yet.
Because the past 17 months have been in a tight bull channel, bulls are eager to buy. Consequently, they will probably buy the first 2 to 3-month selloff. It would therefore become a bull flag. Since the first reversal down will probably be minor, the bears will likely need at least a micro double top before they can create a reversal down.
Since this 17-month rally is unusually strong and it is late in the 8-year bull trend, it is climactic. Even if it is the final climactic leg in the 8-year rally, the bears will probably need at least a double top. Since that would take at least a couple of months to create, the downside over the next several months is probably just a 2 to 3 bar pullback. That means 2 to 3 months. A 3-month bull flag could easily be 150 points tall.
Consequently, it would be a bear trend on the daily chart. Yet, the odds are that the bulls would buy it with a minimum goal of a test of the high.
Weekly S&P500 Emini futures candlestick chart:
Unusually protracted buy climax
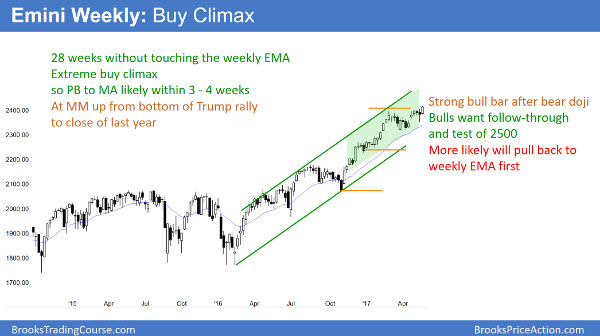
The weekly S&P500 Emini futures candlestick chart is in a strong bull trend. This week was a strong bull trend bar. Yet, the Emini has not touched its moving average in 28 weeks. Since this is the longest stretch in 14 years, it is unsustainable and climactic.
The weekly S&P500 Emini futures candlestick chart has not touched its 20-week exponential moving average in 28 weeks. This is the longest stretch in the 8-year bull trend. It is a sign of strong buying. Yet, when the bulls are strongest late in a trend, they are usually forming a buy climax.
Since most buy climaxes usually lead to a 10 bar, 2 legged sideways to down selloff, that is what’s likely here. However, price is truth, and the buy climax keeps growing. Keynes once said, “Markets cay stay irrational longer than we can stay solvent.”
Just because a pullback is likely does not mean it will happen. The odds still are that the Emini will pull back to the weekly moving average before reaching 2500. The touch of the moving average can come from the Emini going sideways or down.
In the 18-year history of the Emini, there was one other occasion when the Emini stayed above the weekly moving average longer than now. In 2003, it held above for 50 bars. Yet, that was at the start of a huge bull trend after a 50% correction. A bull trend is likely to be at its strongest in that situation. When a bull trend exhibits unusual strength late in the trend, like now, that rally is more likely to be an exhaustive buy climax.
While the odds favor the start of a reversal down within the next few weeks, there is no top yet. However, the more the buy climax extends, the greater the risk of a surprisingly big, fast reversal.
Daily S&P500 Emini futures candlestick chart:
Growing Emini buy climax, but no trend reversal yet
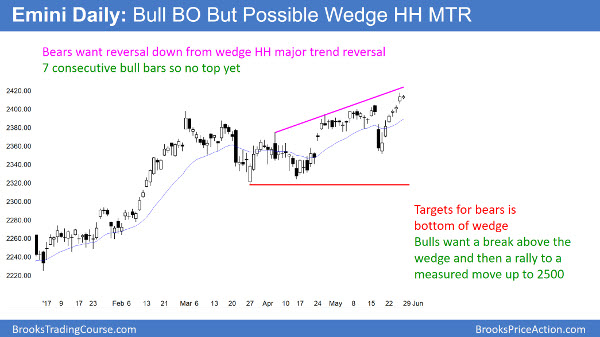
The daily S&P500 Emini futures candlestick chart formed 6 consecutive bull bars before Friday’s pause. There is no sign of a top. The bulls want a measured move up from the 80-point tall, 2-month trading range. Yet, the bears want a wedge higher high major trend reversal.
The daily S&P500 Emini futures candlestick chart rallied to a new all-time high this week. While it is still in a strong bull trend, the weekly buy climax makes a 100-point pullback likely soon.
Despite the strong rally, it is the 3rd push up from the March 27 bottom of the 2 -month trading range. Furthermore, a reversal down would trigger a sell signal from a wedge higher high major trend reversal. In addition, it would be around a measured move up from the 2014–2015 trading range. That trading range is a likely final bull flag on the monthly chart.
Finally, the unusual buy climax on the weekly chart make a 100-point correction likely soon.
Amazon and Alphabet (Google) drawn to the 1,000 magnet
Amazon (AMZN) reached 999 and Alphabet (GOOGL) hit 996 this week. Additionally, both did so with unusually strong rallies on Thursday (May 25). That was probably a buy vacuum test of resistance. Furthermore, both got close enough for traders to believe that the Big Round Number was tested. Hence, bulls are willing to take profits and bear scalpers will begin to sell. Therefore, both could pull back from here.
Because the rallies were in tight channels on the daily chart, the bears will probably need at least a micro double top before they can create reversals. Yet, the rallies are parabolic buy climaxes. Hence, the odds favor profit taking soon. Consequently, both will probably pull back soon, whether or not they first go $20–50 higher.
Why is this relevant? Can these two stocks lift the stock market? No, but the reason why they are racing up is because the bulls believe the overall market is strong. Hence, they believe the downside is small near-term. They have therefore been willing to buy at the top of a buy climax, confident that both would test 1,000.
Thus, they are not pulling the market up. Yet, they are a reflection of how strong traders believe the overall market is. Their strength tells traders that the Emini is strong enough to support rallies in overbought stocks.
Since the bulls met their objective of testing 1,000 in both, they might be willing to take profits. Hence, both can pull back at any time. That would probably come with a pullback in the Emini as well.


