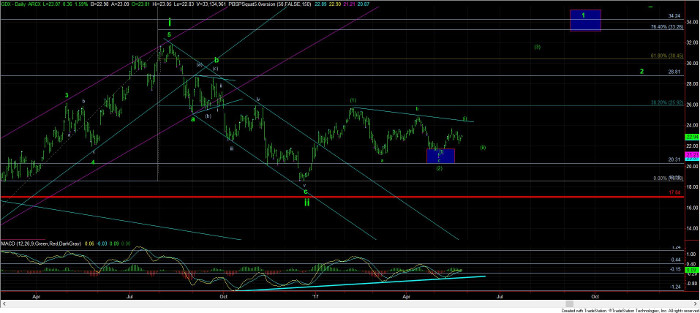
If we see gold and GDX break out over their April highs, then we have a signal for the resumption of a very strong rally back to the August 2016 highs. I don’t think that is the higher probability in the coming week, asserts Avi Gilburt.
In fact, even those who follow standard technical analysis or symmetry perspectives have been whipsawed quite terribly in the last several years, with many of them turning strongly bearish as we were hitting significant lows. For those who readers and members of ElliottWaveTrader.net have been with us for the last year, you will remember that, once I turned short term bearish the SPDR Gold Shares (GDX) back in September 2016, I expected a heads and shoulders pattern to set up into the end of the year, and fake out most market participants, which would then set up a fast 10%+ rally. In fact, I began writing about this potential in early October, well before that set up took shape. Yet, is that not what we saw off the December lows, as the market proceeded to give us a 40% rally in less than two months?
But, as you know, market sentiment and the patterns it creates in the market are what have guided me to turn bearish the metals market September 2011, bullish the market at the end of 2015, and it also guided us correctly in almost every twist and turn since that time. While I did incorrectly remain bullish the market at the August high of GDX, I only missed 3 points of the drop off the high in GDX, and then turned short-term bearish the market with a target in the 19-21 region. And, when we struck our downside target, I correctly turned bullish again.
So, these patterns have provided me with two main clues which suggests that the probabilities that the bear market will return is rather low. In fact, I would be hard pressed to be believe it is greater than 35%. Therefore, I am estimating that the probabilities that the bull market has returned still remain in the 70% region.
I am sure that those that look for certainty in the market will not be comforted by this perspective, but you must remember that we have to view non-linear markets from a perspective of probabilities rather than certainties, as there is almost nothing in life which is certain. As a former tax lawyer, we used to joke that there are three things that are certain in life: death, taxes, and tax reform.
You see, after a bear market bottom is struck within a target region we have identified as a bottoming target, we look for an impulsive 5-wave structure off that bottoming region to signal a significant trend change. Not only has the GDX and HUI Index provided us with that confirmation off the 2015 lows, but the pullback after that 5-wave structure completed exhibited an overlapping, corrective pattern to the downside. That is strongly supportive of the i-ii bullish wave count we have on our charts.
Moreover, since we bottomed in that overlapping, corrective pattern to the downside, the market provided us with another impulsive 5-wave structure off that low, as we rallied into the February high. We then dropped in what is seemingly another 3-wave pullback off the February high. So, again, the market is still supporting our longer term bullish thesis.
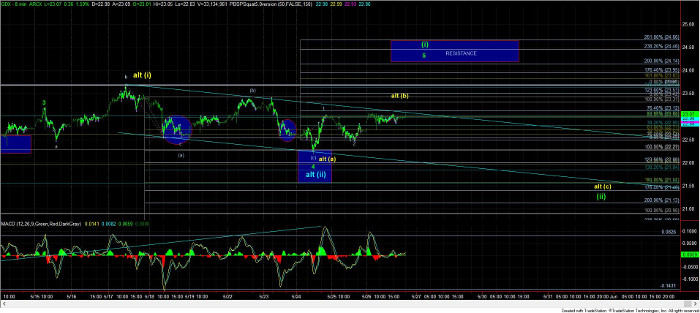
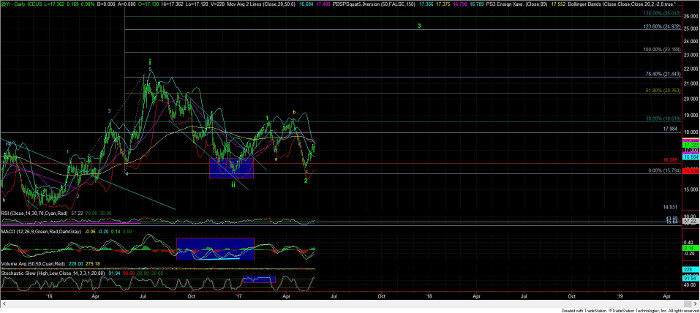
For now, nothing has changed my longer-term perspective. And, as long as the GDX does not break below 20.89, I see the potential for a very fast and strong bullish move back up to the August highs setting up. However, the consolidation we have been experiencing as the market develops this set up has certainly worn the nerves of many investors/traders quite thin.
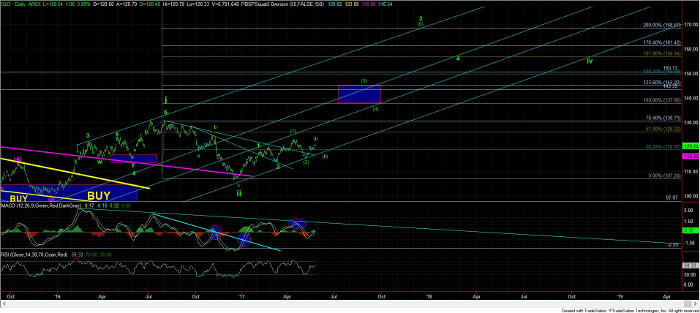
While the smaller time frame has left me with some questions, I will say that the action we saw this past week (ending May 26) in GLD has certainly made me a bit more comfortable with the smaller degree bullish set up I am following. If you may remember from last week, I noted that the GLD really needs another move up towards the 121 region off its May low to provide us with another 5 wave structure, and this past week provided us with that move. However, the GDX has not followed suit, which makes me consider that the high struck almost two weeks ago may have been the top of its 5th wave. My preference would still be to see a higher high struck in GDX up in the 24 region for a better 5 wave structure off its May low, but the market does not always provide us with the ideal and most perfect structures we want to see, especially at the smaller wave degrees.
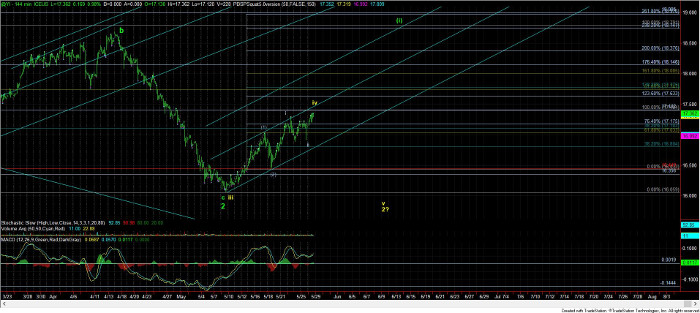
As far as silver is concerned, I have noted within the last week that silver can still strike a lower low just below the 16 region, as long as it remains below 17.40, and that is still possible. It is due to the depth of the pullback seen on May 18 which has caused me to be more uncertain as to how silver is playing out in the smaller degree. But, there is nothing that is suggesting to me that we have to turn bearish as long as silver remains over 15.80. In fact, a strong break out over 17.40 would be a very strong bullish indication, and the market has been hovering just below that region over the last week.
As far as the technicals are concerned, over the last weeks, I have highlighted how the MACD on my daily GDX chart is strongly supportive of the bullish perspective we have retained in the complex. At each consolidation, the MACD has provided us further and further positive divergences, which is ordinarily suggestive of the market building itself up for a powerful break out. Again, this is all based upon probabilities rather than certainties. In the minority of times you see the markets break those divergences. But, in the great majority of the time, the market follows through with strong rallies that surprise most market participants.
Last weekend, I noted: In the smaller time frame, the market does not yet look ready for the major break out I want to see. Yes, I know this has been frustrating to many, but my preference is for the market to see another smaller pullback over the coming weeks before it is ready to break out. Of course, I could be wrong, and if we see gold and GDX break out over their April highs, then we have a signal for the resumption of a very strong rally back to the August 2016 highs. However, based upon the micro wave counts, I don’t think that is the higher probability in the coming week.
So, as I say this time and again, the market seems like it is still trying to set up for a strong break out back towards its August 2016 highs. Yet, it does not look quite ready for that just yet, unless we see us taking out the April highs sooner than I expect. So, it means we still need to be a bit more patience, as well as cautious, as the market has not yet provided us with the cue to turn aggressively bullish the complex just yet.
As of my writing this weekend’s update, nothing I have seen has changed my perspective at this time. I still think we may see the market consolidate a bit more, even if the GDX takes a run at the 24 region in the coming week. In fact, since the GLD has now seen 5 waves up off the May low, and even if it does run a bit higher to complete a more protracted 5 wave structure, it is still suggestive of needing a wave (ii) pullback, which can still take us another week or two.
So, while my bigger perspective in the complex remains bullish, we may need a few more weeks of patience before this potential rocket gets ignited. In the meantime, I have provided you with general parameters of what I am watching in the smaller time frames, with the May lows as being important support in the short term for GDX and GLD, and the April highs as being the resistances. I am not expecting either will be broken over the next week or two, and as long as they are both respected over the coming week or two, then we will retain that rocket-ship set up in the complex into the summer. A break out over the April highs at any point in time now may certainly signal that the rocket blastoff is working on an earlier schedule than I am currently expecting based upon the probabilities as evidenced in the market structure.
See charts illustrating the wave counts on the GDX, GLD, & silver futures here.
Subscribe to Elliott Wave Trader here...