

I started to write this series of articles to help my clients better understand what “Algo” trading is, what the various inputs and factors are, so that you have a comprehensive idea how we can facilitate these concepts in our trading routines so that we boost our performance.
As promised, this weeks’ article will delve into the concept of “holding periods” and a few other choice treats that will help better serve you in the “Algo” trading world.
Before we begin, I think we can all agree that in order to make money trading, the markets need to move; and when we are in the market, we need to be right more often than we are wrong, and we need to make more money on our winning trades than the losing ones. That is where the term “holding” period comes into play and why it’s an important topic.
Under the current trading environment most momentum and trend-following traders might be suffering, but not sophisticated trading systems or as they are affectionately now known as “Quants and Algo traders”. This group can alter their models to such market conditions.
Currently we are in both a light volume and low volatility market environment. I am not referring to the CBOE’s Volatility Index ($VIX) I am looking at a rate of price moves or daily range measurement in the major markets like Gold, Crude Oil, the Euro Currency Treasury Bonds and the S&P 500. An old tool developed by Wells Wilder known as Average True Range (ATR) can help determine when we are entering a low volatility environment. This is a calculation that can look at the true range on average over a period of time.
My second book titled Candlestick and Pivot Point Trading Triggers (John Wiley & Sons) came out over a decade ago and discussed how I use this tool to help set profit targets (page 265), with a specific moving average time period. Another way of using this tool is to help define what the potential is under current market conditions we can expect a markets price range within a specific period. This is helpful two-fold. Once to give us a profit target when prices are near their expected daily ranges and second to help us avoid going long on a momentum breakout at the potential high of the day.
Say for example Apple ($AAPL) has a 5 day ATR of a $1.86, if the stock has a current range of $1.80 one may want to reconsider waiting a day or so to buy a pullback as the price has almost reached its average range over the last five days. Of course, this excludes special trading sessions like an earnings report or a high impact economic report that this or any stock may be sensitive to like the monthly unemployment report or the Federal Reserve’s Open Market Committee meeting announcing a potential interest rate hike.
Day and swing traders may also find value in the ATR figures to find out what the potential range might be especially when combining daily Persons Pivot Points and the PPS indicator.
A dynamic set-up would be if the market fell to the predicted daily support and flashes a PPS or a HCD buy signal, one can estimate what the upside target may be or at least get a feel for what the minimum profit target might be using this tool. Another method is to help determine if the stock or futures product is under or underperforming relative to its recent trading range characteristics.
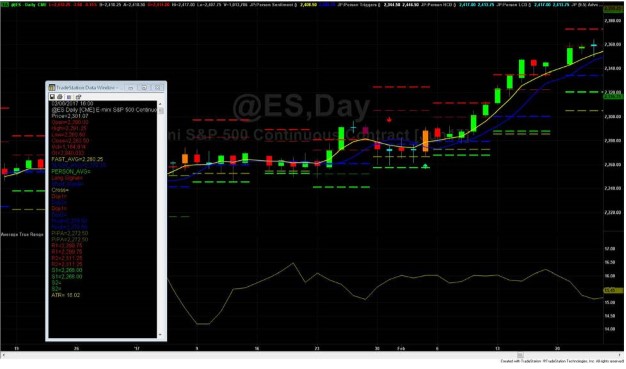
Examine the chart below, which is a daily chart on the Emini S&P futures contract. We have the Weekly Persons Pivots with the PPS arrows and the ATR analysis in the lower quadrant. On February 3rd, the “Algos” generated a PPS buy signal which coincidently formed a daily HCD set-up as indicated by the orange colored candle. The ATR calculation showed a reading of 16.02 which can be found in the insert window box at the bottom. If the ATR is 16 then after a buy signal if the next day’s range is 10.75 (High 2291.25 minus low 2280.50) a trader knows the market is below what the average daily range is and could expand over time. This information helps identify the market has potential to see follow through or it can increase the confidence in the signal. As it turns out the price did expand in the right direction of the original PPS buy signal.
Algorithms like the one above, can be programmed to aid the system trader to stay in the long position, which will also help understand when one should continue to hold a long position or cut the trade early. This “holding” period can also be determined by other means based on back test results, which share details like the usual time period that it takes to see a trade reach a predetermined profit or how long on average it takes to experience a loss.
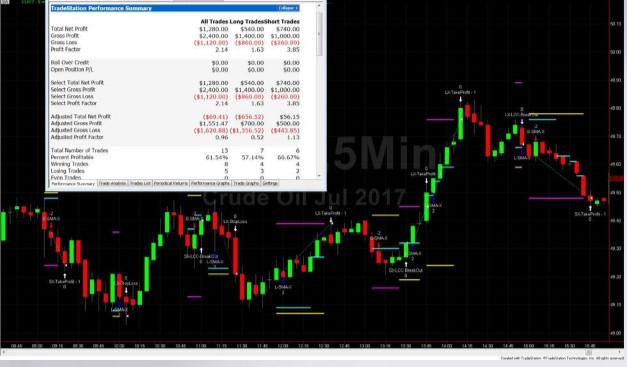
This concept of predetermined profits usually can be based off a predetermined risk factor or market conditions. Case in point is this simple day trading system using the Crude Oil futures market. Examine the chart below, it shows the entry and exits based on trades from Tuesday May 30th.
For starters, let us first disclose that past performance is not a guarantee of future results. This system trades a minimum of two contracts. You will also see there were 13 total trades from the starting time of the system (9:00 AM until 4 PM ET). There were only 8 winners or a 61.54% profitable trade rate. The profit factor was a net 2.14. IF you examine the signals you will see there is a stagnant profit and risk target. The “holding period” for any trade that has not met its profit or loss targets exits or gets flat by the close.
One very important point that traders need to understand is that no trading system is 100% profitable in all of its trade signals. The second most important point is that when the target price is reached the system needs to exit the trade or have a trailing or scale out mechanism. If the trade exited and the criteria’s still warrant entering a trade, the system enters another trade.
That in itself is a hard action to take when trading on a discretionary basis.
Notice the systems entry and exits from the 1:30 PM time-frame; it went long, then took the profit, then, the system went long again at 1:45 PM and exited right before the highs were put in by 2:10 PM.
Exiting trades also is determined by “holding periods” the average length of time “trends” take place in a particular market. Therefore, profit targets necessarily, are not just determined by price, but also time considerations. At the end of this trading session, the “system” nets a total gain of $1280; but only if one took every signal or automated this strategy to enter orders.
Also, notice that in the system above, the short trades actually had a better result than the longs. Remember the old adage “tops take longer to form than bottoms?” Well that phrase may be applicable in determining “holding period” as well and suggest that the time to take a profit in a “sell signals might not be as long as it would for a buy signal.
Holding period can also mean take X profit within X time frame. Can one “Algo” or trade model be applicable for all markets? Some trading models work better in some markets in specific time-frames better than other models. One of the biggest issues is volatility and of course liquidity.
Can one get in on these trade signals with large size in some futures, ETF and Stocks without creating “slippage”?
Of course, “size” is a relative word when measured against a low volume and smallranged trading session. On this trading day, the range during that trading time was .80 cents (High $49.83 low $49.03). The 5-day ATR was $2.73; the 20-day ATR was $1.73.
So how would the ATR’s help in this particular “Algo” trading system? It wouldn’t. This was a trick question; the reason ATR would not be applicable in this trading model is that it is a day trading system with stagnant entries and exits.
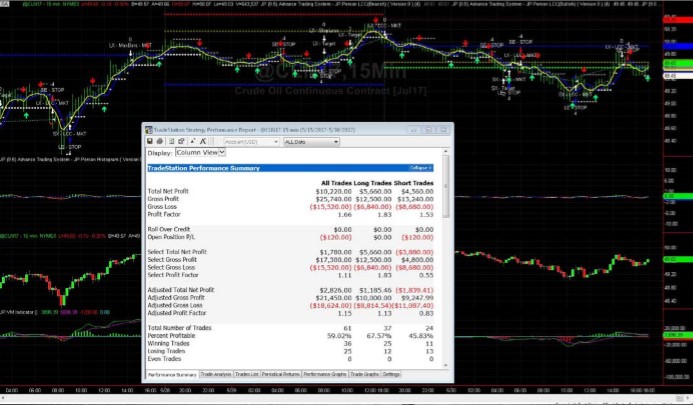
However, let us look at the next system, which has more rules and thus programming code. This model is based on a 15- minute time-frame and trades during “peak” trading sessions, meaning it captures the European and US trading sessions.
In a sample period of two weeks from May 5th through May 15th of this current year, we have a different profit factor of only 1.66 there were a total of 61 trades with 36 winners and 25 losers ending with a 59.02% profitable rate and a net, $10,220.00 in profits trading only two (2) lots.
First of all, a 15-minute time frame is three times that of a 5-minute time period so if you have a “holding period” of 50 bars for a 5-minute time frame that equals to 250-minutes or two hours and ten minutes. If you use the same parameter for the holding period for a 15-minute time frame system you are now in a trade for 750-minutes or 12.5 hours. That means you could be in a trend too long to exit a profit target.
As you can see, trading system development needs to address-holding period’s and make a set of rules independently for various time frames.
The next few articles in this series looks to expand on the importance of Liquidity and how that can impact the execution of trades so one does not experience undo “Slippage”.
Plus, we will expand more on why we want to incorporate “Spreads” in our trading models, from various market products but also time frames. Remember in this advanced trading environment diversification comes not from just trading different products; system trading models can be within the same product using different time-frames. For example, one can have a swing trade or overnight trading model using a daily chart using 60 minute time frames and on a different system or trading account taking counter trend trades using either a 5 or 15 minute time frame chart.
I hope you found this week’s article helpful in learning more about what goes into trading system models.
For more information on Persons Pivots, HCD or PPS indicators please feel free to visit www.Personsplanet.com where you will find a host of free training videos.


