

The odds are that the Emini will follow the same path down to the bottom of its final bull flag over the next several months, asserts Al Brooks, MD, in his weekend Emini update.
Monthly S&P500 Emini futures candlestick chart:
Buy climax is more important than Trump, Comey, and May
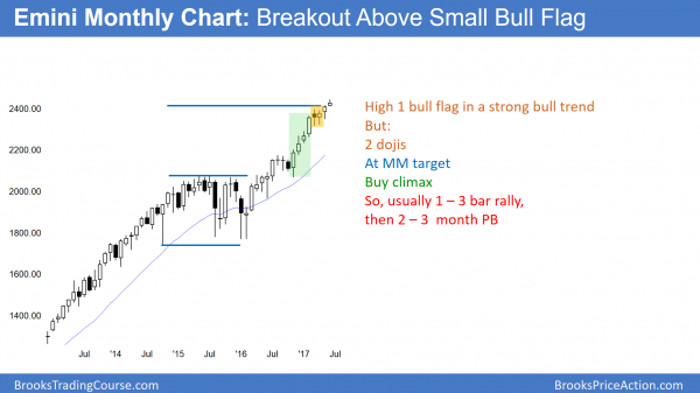
The monthly S&P500 Emini futures candlestick chart has been in a strong bull trend for 18 months. Furthermore, there is an 8 bar bull micro channel (no pullbacks).
The monthly S&P500 Emini futures candlestick chart had a High 1 bull flag in April. Yet, it was after a 4-month buy climax. In addition, it was at a measured move up from the 2014–2015 trading range. A breakout above High 1 bull flag after a buy climax at resistance usually only lasts a few bars. This is the second month. Then, the chart typically pulls back for a few bars. That would be a few months on the monthly chart.
Because the 18-month bull channel is tight, the first reversal down will likely be minor. Therefore, bulls will probably buy a 2–3 bar pullback. A 3-month pullback on the monthly chart could fall 150 points from the high. While this would be a bear trend on the daily chart, it would simply be a bull flag on the monthly chart.
Some minor reversals lead to major opposite trends. However, most traders want to see either a very strong reversal down or a series of 3 or more bear bars before they will believe that the bears have taken control. Most tops typically need at least a micro double top. Therefore, bulls will buy the first reversal down, confident that the bears will not sell aggressively at least until there is a rally back up to test the old high.
Weekly S&P500 Emini futures candlestick chart:
Extreme buy climax
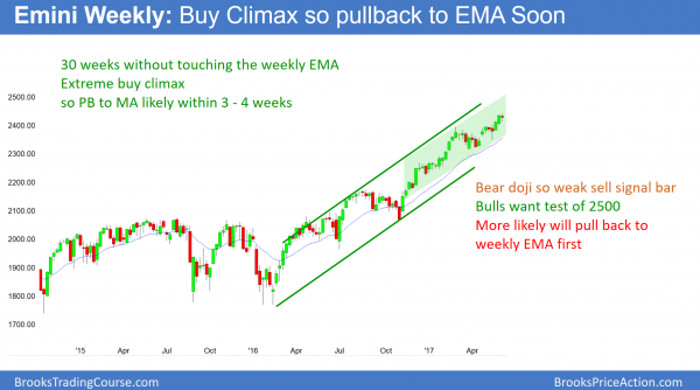
The weekly S&P500 Emini futures candlestick chart has been in a tight bull channel for 18 months. Yet, there have been 3 small pushes up from the March 27 low. Hence, this is a potential parabolic wedge top. However, this week is not a strong sell signal bar. While it had a bear body, it had a prominent tail below. Because the context is good for a reversal down to the weekly moving average, traders should be ready for a selloff. Furthermore, it might have begun on Friday (June 9).
Extreme buy climax
This was the 30th consecutive week above the 20-week exponential moving average. This is the longest stretch in the 8-year bull trend, and therefore extreme. Furthermore, it is the 2nd longest stretch in the 18-year history of the Emini.
The longest one was about 50 weeks. That was in 2003 and on a reversal up after a 50% collapse. A rally in that environment is often extremely strong. Yet, the current rally is late in a bull trend. When there is exceptional strength late in a trend, it is more likely exhaustive.
Since a trend can last much longer than what seems logical, it is too early to be looking for shorts. However, because a correction down to the weekly moving average will likely begin soon, buying here is risky for traders. A trader is someone looking to take profits within a week or two. They are buying because the momentum up is strong on the daily chart. However, they can only buy here if they are comfortable managing their trades if there is a sharp reversal down.
Daily S&P500 Emini futures candlestick chart:
Probable bull leg in trading range
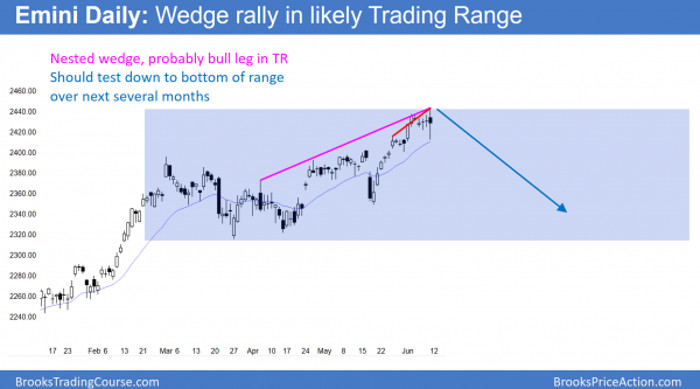
The daily S&P500 Emini futures candlestick chart formed a big outside down day on Friday. Yet, it closed far above its low and back in the 5-day tight trading range. However, it has had 3 legs up from the March 27 low. This is, therefore, a wedge rally. Furthermore, it is nested. This is because there are 3 smaller legs up since the May 18 low.
The daily S&P500 Emini futures candlestick chart has a nested wedge rally. In addition, the March–April trading range is a potential Final Bull Flag. While there is no clear sign of a top, the odds are that the upside is small from here.
While Friday was an outside down bar, it had prominent tails. Furthermore, it is in a 5-day tight trading range. Therefore, the bears need more before traders will believe that the bears have taken control. Yet, the context is good for a selloff beginning anytime.
The rally from the March 27 low is probably a bull leg in what will become a trading range. Therefore, the odds are that the Emini will soon begin a bear leg down to the bottom of the trading range. Since that is the March 27 low of 2315.75, that would be a 100+ point correction.
This rally is similar to the one in the bank stocks that ended on March 1. It was followed by a selloff to the bottom of the January Final Bull Flag. The odds are that the rally in the Emini will lead to a similar selloff over the next several months.
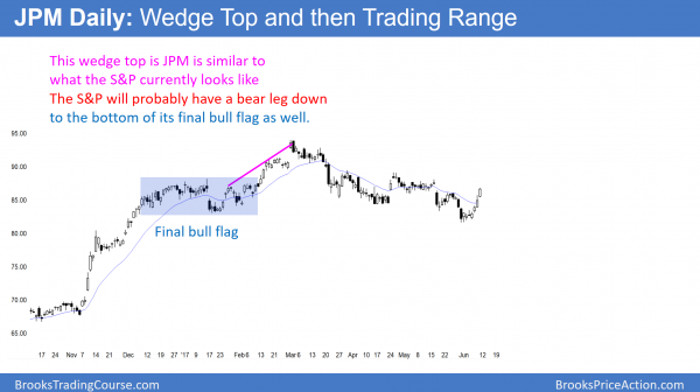
The wedge rally to the high on the daily chart of JPM is similar to the current rally in the S&P500 and Emini. The odds are that the Emini will follow the same path down to the bottom of its final bull flag over the next several months.


