

I will continue to play this bullish market, but I am keeping my stops reasonably tight. When in doubt, I close, asserts Kerry Given, PhD, founder of Parkwood Capital and a co-founder of G&L Capital Management.
Markets have traded strongly higher since the market sell-off on May 17, but that ended the week ended June 9 as prices stalled. The Standard and Poor's 500 Index (SPX) opened the week at 2437 and closed Friday, essentially unchanged, at 2432. Friday's price action on the S&P 500 ranged widely, trading up as high as 2446 Friday morning, but then trading down to 2416 that afternoon, before recovering somewhat into the close. SPX trading was very bullish over the last fifteen minutes of trading. Trading volume spiked during those last few minutes.
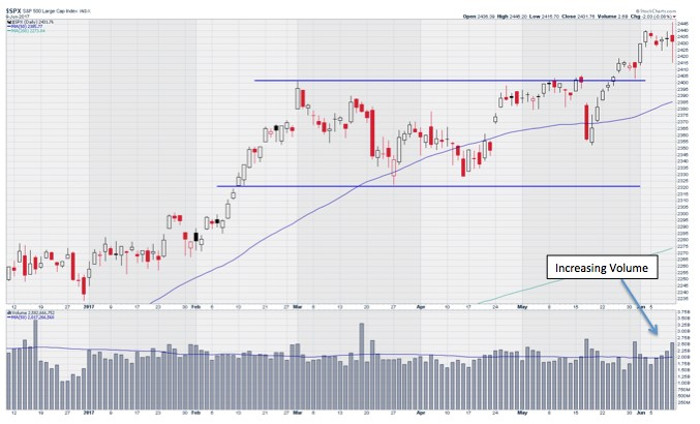
Standard and Poor's 500 Index (SPX)
Chart courtesy of StockCharts.com
I find this significant increase in trading volume as prices recovered to be a very bullish signal-another example of market participants buying the dip. The bulls are still in control.
SPX trading volume grew steadily all week, peaking Friday at 2.6 billion shares, well above the 50-day moving average (DMA) at 2.0 billion shares.
We plot Bollinger bands on a stock or index price chart as two lines drawn at plus and minus two standard deviations above and below the 20 DMA. Statistically, we may expect about 95% of the price data to be within the Bollinger Bands. SPX ended the week (June 2) week just outside the upper edge of the Bollinger bands. Last week's trading pulled SPX back within the Bollinger Bands, although SPX remains in the upper quartile of the bands. Market control remains with the bulls.
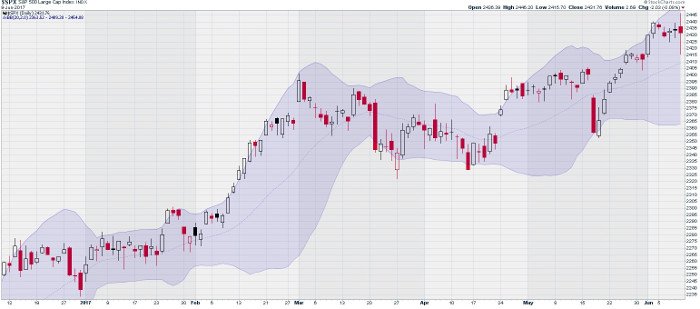
Standard and Poors 500 Index (SPX) with Bollinger Bands
Chart courtesy of StockCharts.com
The Russell 2000 Index (RUT) has stubbornly lagged behind the other major market indices all year, but RUT woke up late last week, with large moves higher Thursday and Friday. RUT closed Friday at 1422, up 6. This close is right at the upper edge of the trading range that RUT has held since last December.
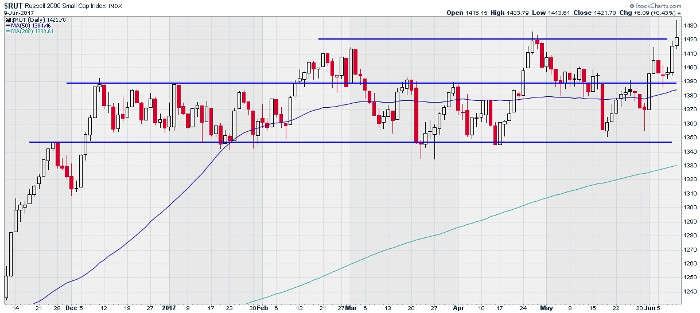
Russell 2000 Index (RUT)
Chart courtesy of StockCharts.com
RUT broke out and traded as high as 1434 earlier Friday, but couldn't hold that high. Historically, small and mid-cap stocks always lead bullish markets upward and bearish markets downward. When traders are bullish, they tend to buy higher beta stocks with high-profit potential. Conversely, when markets cool, these same high beta stocks are the first to be sold.
Russell's apparent revival may be a leading indicator of the continuation of this bullish trend higher yet. I will be watching RUT this week to see if it can break out and close well above the upper edge of the trading range. That would be the final bullish indicator that has been missing thus far.
The Dow set an all-time high June 9, RUT made a valiant effort to break out of its sideways trading range, and SPX remained essentially unchanged. But the NASDAQ Composite told a completely different story. NASDAQ plunged 114 to close at 6208, nearly a 2% decline. NASDAQ trading volume spiked higher today to 3.1 billion shares, well above the 50 DMA at 1.9 billion shares.
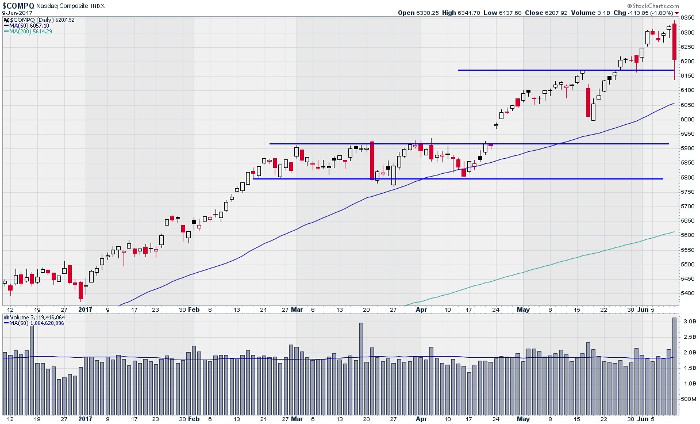
NASDAQ Composite Index
Chart courtesy of StockCharts.com
Intraday trading on NASDAQ followed a similar pattern to the other major indices, hitting its low about an hour before the market close, and then recovering somewhat into the close.
This huge decline on NASDAQ was triggered by a Goldman Sachs report critiquing the high stock prices of the high-tech market leaders such as Apple (AAPL), Alphabet (GOOGL), Nvidia (NVDA), and Facebook (FB). The resulting high-tech sell-off triggered the S&P 500 Volatility Index (VIX) spiking up over 12% today, but VIX recovered significantly, closing at 10.7%, only up about a half percent on the day.
Friday's markets gave us a wide range of price action with a huge decline on NASDAQ contrasted with the small caps in the Russell 2000 index finally coming to life after trading sideways all year. What should we conclude?
It was only about three weeks ago that the markets gapped open lower and traded off significantly, spooking many market observers. But the bulls came roaring back, not only recovering the losses but also setting new highs. The pullbacks continue to be aggressively bought. The bulls are strongly defending any attempts to push the market lower. You can even see that bullish behavior in Friday's trading when the trading volume spiked as traders recovered much of the losses during the last few minutes of trading.
The bullish strength of this market is remarkable when you consider all of the political and global distractions. This market consistently trades higher, seemingly ignoring all of the bad news.
I will continue to play this bullish market trend, but I am keeping my stops reasonably tight. It remains a nervous market. When in doubt, I close.


