

While a news event often causes an initial breakout that leads to a big move, it is usually the result of technical factors. For example, the stock market usually has to go too far to know if it has gone far enough, asserts Al Brooks, MD, in his weekend Emini update.
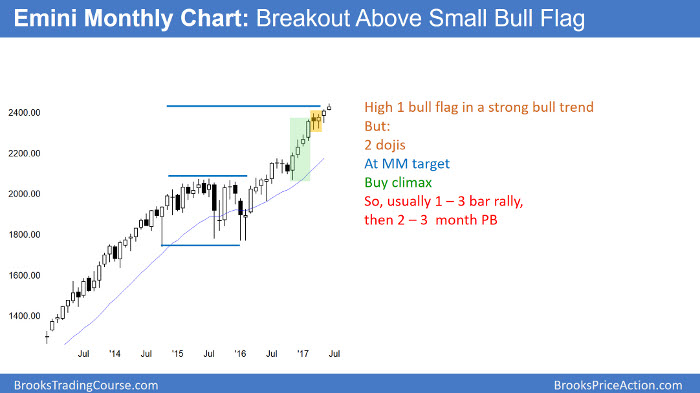
The monthly S&P500 Emini futures candlestick chart had a doji buy signal bar in April. Furthermore, it followed a 4 bar buy climax. Finally, it was around a measured move up from the 2014–2015 trading range. Consequently, the odds are against a strong rally. Typically, the breakout lasts 1–3 bars (months), and then corrects for a few bars. Since this is the 2nd month, bulls will be quick to take profits. In addition, bears will be looking to sell.
Since the 18-month rally is in a tight bull channel, the first reversal down will probably be minor. That means it will probably last only a few months before the bulls buy again. However, because the 2014–2015 trading range formed late in a bull trend, it will probably be the final bull flag.
Therefore, any rally from here will probably not get far. Instead, the Emini will probably correct down to the 1800 bottom of that final flag within the next few years.
In summary, there will probably be a 2–3-month correction that starts within the next month. It will probably fall to around the April low, which is more than 100 points below the high. While that will be a bear trend on the daily chart, it will be a bull flag on the monthly chart. Therefore, the odds are that the selloff will be followed by at least one more rally that tests the high.
Weekly S&P500 Emini futures candlestick chart:
Extreme buy climax so correction soon
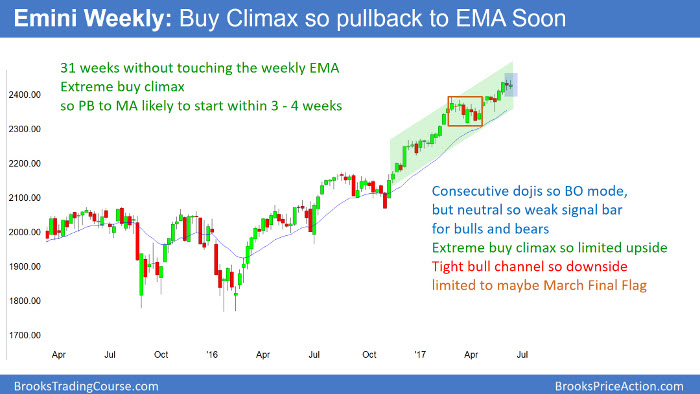
The weekly S&P500 Emini futures candlestick chart has been above its 20-week exponential moving average for 31 weeks. This is extremely unusual and therefore unsustainable and climactic. This week was a doji inside bar, and last week was a doji bar as well. Hence, this is a breakout mode setup.
This week was an inside bar in a bull trend. It is, therefore, a pullback and a buy signal bar for next week. Yet, it is a doji bar and last week was a doji as well. This is a weak buy setup. Furthermore, the weekly chart is in an extreme buy climax. Therefore if next week trades above this week’s high and triggers the buy signal, the odds are that the rally will be brief. In addition, the Emini will probably soon reverse down.
If instead next week trades below this week’s low, it would trigger a sell signal. Since the bull channel is tight and a doji is a weak signal bar, this is not a strong sell setup. But, because the weekly chart is so overbought, there is an increased chance that this could be the start of a 2–3 months selloff.
Unusually extreme buy climax
The weekly S&P500 Emini futures candlestick chart is amazing! It has not touched its average for 31 weeks. The only other time in the 18-year history that this happened was in 2003. That is about 900 bars! At that time, the Emini reversed up from a 50% collapse. Therefore, traders expected an extremely strong rally.
Yet, while it stayed above the average for about 50 weeks in 2003, it twice pulled back very close to the average at around 20 weeks. The current rally has not gotten very close. Hence, there was no relief of the overbought condition. Furthermore, it is even more overbought.
The current buy climax is late in a bull trend. When there is exceptional strength late in a trend, it is more likely a climactic end of the trend instead of the start of a new, stronger leg up. Hence, the current rally since March is probably an exhaustive buy climax.
Trading range likely for many months
While it does yet evident, the Emini probably entered a trading range in March. The rally from the March low has had 3 pushes up. This is, therefore, a wedge bull channel. A bull channel functions as a bear flag. Hence, a bear breakout is more likely than a bull breakout. Furthermore, the target of the bears is the bottom of the channel, which is the March low. Consequently, the odds are that a bull channel evolves into a trading range.
Hence, the Emini will probably soon turn down and then work to the March low just above 2300. Since the selloff will be a bear leg in a trading range, it will probably not be sharp, although it will have some big bear days. It might take 2 – 3 months to reach its target. Once it is at the bottom of the trading range, bulls buy to scalp up and bears buy back their shorts. Consequently, the Emini will probably rally from around the March low.
Extreme buy climax, but probably not climactic reversal
When a market is extremely stretched one way, there is an increased chance of an extreme reversal. Because the monthly and weekly charts are in tight bull channels, the odds are against a violent selloff. Yet, it the Emini sells off for 100 points and then rallies back to the high, which is likely, traders will look for a reversal down from a double top. That would have a higher probability of a deep correction.
Daily S&P500 Emini futures candlestick chart:
Nested wedge rally
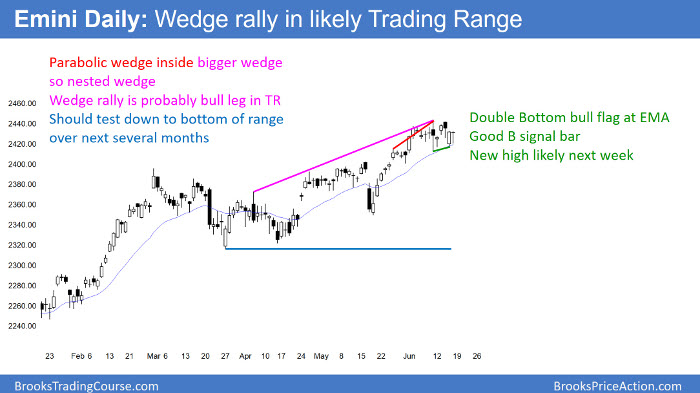
The Emini has been in a trading range within a bull trend. This is, therefore, a bull flag. Since the weekly chart is so extremely overbought, the odds are against a strong bull breakout of the bull flag on the daily chart. If the bulls get their breakout, it probably would fail within a week. This trading range would then be the final bull flag.
Nested wedge top
The daily S&P500 Emini futures candlestick chart has had a wedge rally up from the March 27 low. Furthermore, the 3rd leg up is a wedge in a tight bull channel. It is, therefore, a parabolic wedge rally. It began on May 18, and it has had 3 pushes up, beginning with the May 25 top. Nested patterns have a higher probability of success. However, there is no sell signal bar yet and no strong bear breakout. Hence, the bulls might get one more new high before there is a reversal down.
Bull leg in a trading range
The rally from the March 27 low has had 3 pushes up. The pullbacks were strong enough to make the rally look more like a bull leg in a trading range than a new leg up in a bull trend. From the Market Cycle, traders know that channels usually weaken and evolve into trading ranges.
While there is no top yet or strong reversal down, that will probably happen soon. The bottom of the range would probably be around the bottom of the channel. Since that is around 2300, a selloff to that level would probably be a bear trend on the daily chart. Yet, since the monthly chart is in a tight bull channel, the odds are that the Emini would bounce from that level and have another bull leg in the range.
If the trading range grows to 20 or more bars, which is likely, the bears will try to create a reasonable top. Typically, they will try to form a lower high major trend reversal. In this case, that would also be a head and shoulders top, where the March 1 high was the left shoulder.
The bull would see a rally up from the March 27 low as a double bottom bull flag with that low. Hence, the Emini would be in breakout mode, and the pattern will probably least for at least 2 months.
Mueller’s Trump investigation and correction from buy climax
The media always relate stock market breakouts to whatever is making the news. The current popular story is Mueller’s investigation of Trump. If the Emini sells off within a month, reporters will claim that it was caused by a news event like this. While a news event often causes an initial breakout that leads to a big move, the big move is usually the result of technical factors.
For example, the stock market usually has to go too far to know if it has gone far enough. As a result, once it reverses, it can go very far. It does not matter if the day of the reversal happens when there is news. Nor does it matter if some firms place trades based on the news.
If the market went too far and reverses, the reversal is usually much bigger than what the news would suggest. This is because the technical factors are more important over the course of a few months. The market gravitates toward support and resistance, even if it is farther than what seems possible based on the news that reporters claim is behind the move.


