

I expect the number of unemployed to bottom in the next 6-12 months. After that, the next recession will come 6-18 months later, asserts Don Kaufman. The next recession will come in 1 year at the earliest and 2.5 years at the latest.
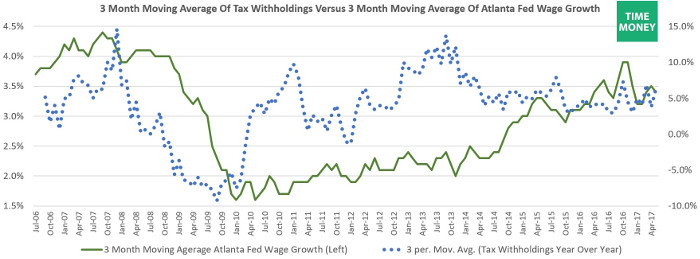
The chart below is an interesting dynamic which is important to determining monetary policy as well as assessing the strength of the economy. It shows the 3-month moving average of the Atlanta Fed’s wage growth tracker compared to the 3-month moving average for year-over-year growth in tax withholdings. Tax withholdings are probably the best way to measure take home pay because people don’t want to withhold more than they’re supposed to, so it shouldn’t be inflated. Wage growth is survey data which makes it less accurate no matter how hard the Atlanta Fed tries to get it right.
As you can see, tax withholdings growth was negative during the recession which is a better description of the money earned in the economy than the over 2% growth in wages in 2008. It’s interesting to see how year-over-year growth in withholdings came closer to reaching the prior cycle high in 2013, while it’s been tougher for wage growth to meet the growth seen in 2007. It seems tax withholdings are a better way to measure the direction of the economy because they started falling in late 2007 while wage growth started falling in late 2008. Withholdings also have had some false signals as they decelerated in 2011 and 2014 without a recession occurring.
It’s great to have a chart with both indicators in it. Because consumer spending makes up two-thirds of GDP growth, it's essential to figure out if people are seeing their pay increase. These trends are better than looking at the monthly BLS reports because those are much more volatile. The struggle is trying to find a balance between using the latest figures and looking at the long-term trends. Cleary, it’s worked in the past few years to follow the trend because a recession has been avoided. However, a bad jobless claims report would probably be the first to tell us if a recession was here. The key is to figure out if weak new data is affected by one-time trends or represents a sea change in the economy.
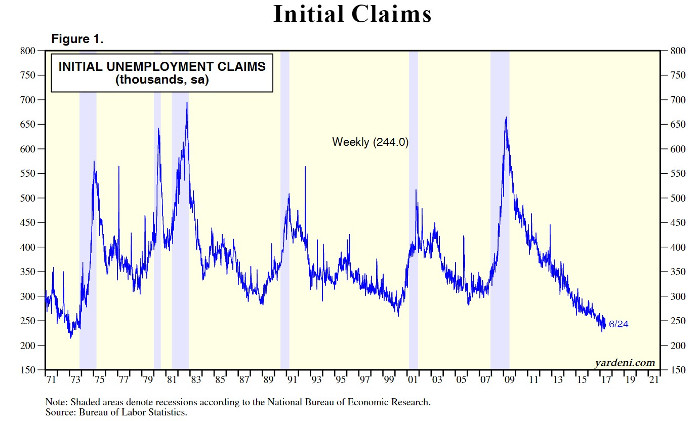
To be clear, I’m not implying that the current jobless claims are signaling the economy is starting to weaken. As you can see from the chart below, the initial jobless claims were 244,000 in the week ending June 24. This was 4,000 above expectations which is nothing in the grand scheme of things. This has been 121 straight weeks where initial claims were below 300,000.
This is an unprecedented streak which will likely never be repeated because of population growth. The 300,000 number used to be a pivotal level because anything above it meant the labor market was weakening. In this cycle, that number should be lowered because by the time it gets above 300,000, the market probably will have sold off.
If the 4-week moving average gets above 275,000 without any major one-time event affecting the results, I will be concerned. We’re not even close to that now as the 4-week moving average is 242,500.
If you look at the pre-recessionary periods in the chart, sometimes the claims rise before the recession, making it a great leading indicator. Sometimes they rise concurrently with the recession like in the last recession. However, keep in mind when it was rising in early 2008, economists didn’t realize we were in a recession, so you could have sold stocks without losing much if you followed the jobless claims reports.
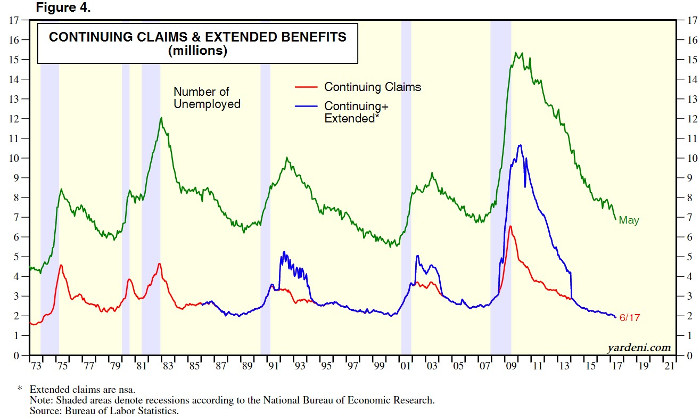
The continuing unemployment claims have been below 2 million for 11 straight weeks. This signals the slack in the labor market is being diminished.
As you can see from the chart below, this low continuing claims rate doesn’t mean the cycle is about to reverse soon. The continuing claims were low for years in the late 1980s and the late 1990s. The green line, which shows the number of unemployed people, seems to be a better indicator if you’re trying to time the next recession.
The number of unemployed people seems to bottom between 5 million and 7 million. After it bottoms, the next recession comes soon. The only time it took more than a year to come was the recession in 1990-1991, but even that signal was only slightly above one year in advance.
The current number of unemployed people is slightly above the bottom in 2007. This indicator makes it look like a recession in the next 3 years is virtually guaranteed. This indicator looks like many others in the sense that it is showing numbers like 2007.
The last recession appears to have been accelerated by the outright fear over the solvency of major banks. With the slowness of this recovery, I wouldn’t be surprised to see things play out slower. The point I’m making is that just because 2017 is like 2007, doesn’t mean 2018 will be like 2008.
I have previously discussed the problems with the jobless claims stats because the labor market isn’t seeing enough wage gains to justify saying the labor market is the strongest ever, It’s not completely broken. It’s not like the labor market is weak.
The two reasons for why wage growth isn’t robust is because the skills gap is preventing wage gains and because the stats might not be accurately showing the growth in pay.
The tax withholdings suggest that the wage growth is more robust than some of the indicators let on.
Conclusion
The first takeaway from this article is that the current economy is more robust than the GDP indicates because tax withholdings are up over 6% in May on a year-over-year basis.
The second takeaway is that the number of unemployed people usually bottoms very close to where we’re at now. I expect the number of unemployed to bottom in the next 6-12 months.
After the bottom, the next recession will come 6-18 months later. That means the next recession will come in 1 year at the earliest and 2.5 years at the latest.


