

The weekly and monthly charts are strongly bullish. The odds are that bulls will buy a 2- to 3-month selloff that will probably lead to at least one more attempt at a new high, asserts Al Brooks in his weekly Trader commentary.
Monthly S&P500 Emini futures candlestick chart:
Buy climax
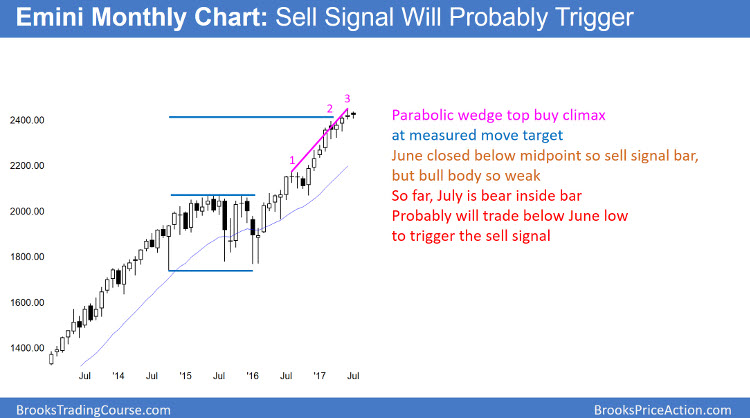
The monthly S&P500 Emini futures candlestick chart is in a strong bull trend. However, it has a parabolic wedge rally. Last month is the sell signal bar.
The monthly S&P500 Emini futures candlestick chart is in a strong bull trend, but it is climactic. The parabolic wedge top will trigger if July trades below the June low. Since the Emini is a measured move up from the 2014–2015 trading range, it is as important resistance. It is therefore likely that July will trade below June at some point.
Also, April was a High 1 buy signal bar. Since it followed a 4 bar buy climax and it is at resistance, the bull breakout usually lasts a few months. The Emini then typically pulls back for a few months. Therefore, the odds are that it will pull back within the next month or two.
Minor reversal only
Since the 17-month bull trend is in a tight bull channel, the downside risk over the next few months is small. Any reversal would therefore probably be minor. This means that it will become either a bull flag or a bear leg in a small trading range. Probably the best the bears can get is a small pullback to around the April low. Yet, that is 100–150 points down. It would, therefore, be a bear trend on the daily chart.
There is a 40% chance that a pullback from a parabolic wedge top becomes endless. This means that it could last 10 or more bars in a tight bear channel. If that happens, then the bears would have a 40% chance of a bear break below that bull flag, and then a measured move down.
Weekly S&P500 Emini futures candlestick chart:
Trump, Putin, North Korea are less important than buy climax
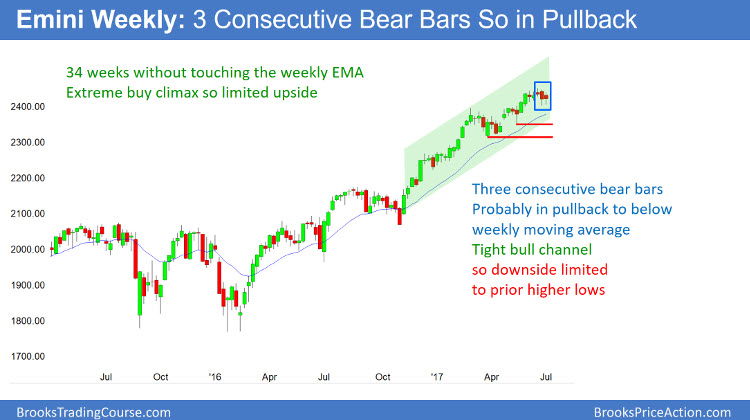
The weekly S&P500 Emini futures candlestick chart has had 3 consecutive bear bars. It is probably pulling back to the weekly moving average
The weekly S&P500 Emini futures candlestick chart is the most overbought in its 18-year history. It has never been this far above the 20-week exponential moving average for this many bars before. Hence, this is unsustainable and climactic. The odds are that it has begun a pullback to below the moving average. When it pulls back to the moving average, it usually falls at least 20–40 points below. That would be around the 2350 area, and hence at least a 100 point pullback.
While it is possible that the Emini makes one more new high before testing the moving average, this is unlikely after 3 bear bars.
Daily S&P500 Emini futures candlestick chart:
Increasing selling pressure
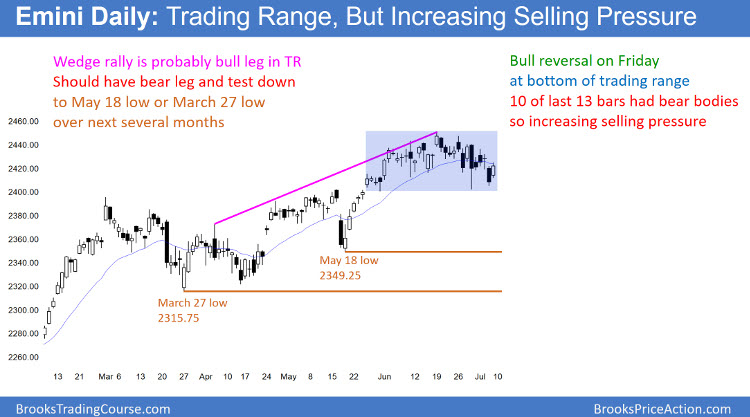
The daily S&P500 Emini futures candlestick chart reversed up on Friday, but there were 10 bear bars in the past 13 days. While still in a trading range, this increasing selling pressure makes a bear breakout more likely.
The daily S&P500 Emini futures candlestick chart has been in a trading range for a month. However, it has had 3 pushes up from the March–April trading range. This, therefore, has been a wedge rally. A wedge rally after a final flag is usually a bull leg in what will become a trading range. Hence, it usually leads to a bear leg in the developing range. Furthermore, that March-April trading range is a likely final bull flag. Consequently, the Emini will probably begin to pull back into that bull flag.
A logical target for the bears is a test of prior major lows. The first one is the May 18 low at 2349.25. If the Emini breaks below that, the next target is the bottom of the trading range in the 2300 – 2320 area.
If the Emini falls to that area, it will probably go sideways for a month or two. This is because it is support, and the weekly and monthly charts are so strongly bullish. The odds are that bulls will buy a 2- to 3-month selloff to that support level. Hence, the selloff will probably lead to at least one more attempt at a new high.


