

Seasonality kicked in as gold broke below its December 2016 uptrend dropping over $20 last Monday in light trading. Gold is now holding at its 23 mont moving average, but it’s still looking vulnerable for more downside, notes Omar Ayales, gold specialist and editor of Gold Charts R Us.
The entire gold universe took a dive. Silver dipped below $16 and tested its December lows, while gold shares reached their Mar/May lows near 180. On the brighter side, the A/D Line continues to hold above its own uptrend since Dec 2016 reflecting gold’s backbone strength.
And although many were surprised, we’ve been patiently waiting for lower lows to add to our positions. And that we did! We bought more gold, silver and Agnico-Eagle Mines (AEM) as we continue to accumulate during weakness.
The B decline finally hit a higher gear and you could see more downside pressure short-term. But the good news is the decline is getting closer to a bottom.
Gold has now declined 6% since the ‘B’ decline started about 11 weeks ago. Keep in mind an average decline for ‘B’ declines range anywhere from 6% to 11%.
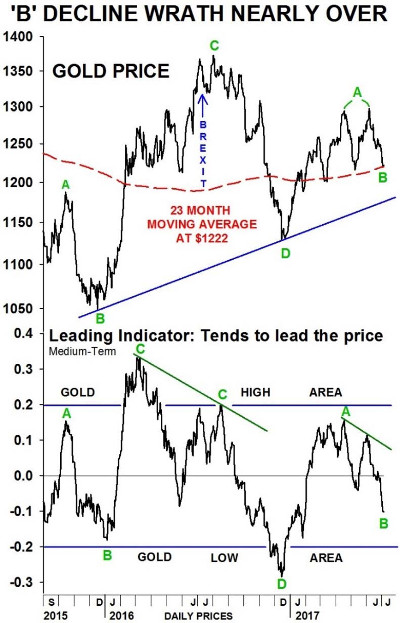
The chart above starts near gold’s bottom in Dec 2015. Coincidently, that was gold’s last ‘B’ decline. At that moment, the ‘B’ decline overshot the ‘D’ decline, which was unusual but it marked a key reversal low for gold.
The decline was followed by a strong and bullish 'C’ rise to $1380 during 2016. Gold peaked at the height of Brexit concerns and coincidently, right at a 3-year high resistance near $1380. Gold then declined in normal ‘D’ decline fashion until it reached the Dec 2016 lows.
From then on the 'A' rise in gold developed this year in a decent rise and now so far the 'B' decline has been within reason. The As and Bs tend to be a consolidation pattern following a strong 'C' rise.
Notice gold's leading MT indicator on the chart is now falling and finally picking up steam as it nears an oversold level. This means the 'B' decline is nearing maturity.
It seems as if the indicator is telling us gold’s downside is limited to the $1190-$1200 level. That also means gold could possibly fall another $20-$30 and still remain within a bullish uptrend cycle since Dec 2015. If gold declines to that level, we recommend adding to your positions once again.
We’ve been waiting for these lows for a while now and don’t want to get whipped out and miss the long awaited ‘C’ rise. Most of our positions are near the low area and are poised to perform and deliver handsome profits by the time the rise we call ‘C’ starts, develops and matures.


