

We’ve been skeptical about buying into the gold bulls’ case for quite awhile, and are neither surprised nor unhappy about gold approaching the $1200 mark, notes Jon Strebler, editor of Dow Theory Letters.
Is this our chance to buy? Probably not yet. On the fundamental side, gold responds mostly to the prospect of inflation, and to geopolitical concerns. Despite numerous efforts to talk up inflation in various corners of the globe over long periods of time, the fact is that prices just really do not want to go up in any significant way.
For decades (in the 1970s, 80s, 90s) we’d talk about this thing called “deflation,” or a persistent decline in overall prices. We warned that it could come back at some point in the future–and people just smiled: “Deflation? Are you kidding me?”
We’re almost at the flip side of that mentality these days, where disinflation (the lack of significant inflation or deflation) is so firmly entrenched that substantial inflation seems like something from the far past, unlikely to ever reappear. So gold is fighting that strong headwind.
The geopolitical front isn’t helping either, and that’s surprising. We have the U.S. stepping aside as the free world’s leader, seemingly more at ease with Russia than our traditional allies, even as that country seizes Ukrainian land and attacks our elections.
There’s North Korea, quickly developing nuclear weapons to strike the U.S., and China menacing any country approaching its “territory” in the China Sea, both newly-created and poached from others. Not to mention Brexit, Poland opting for authoritarianism, and Congress unable to pass any meaningful legislation.
In the past, any one of these would have tended to move gold solidly higher, but nowadays gold goes nowhere; just not interested.
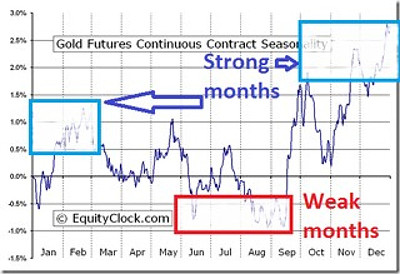
So what’s it gonna take? I have no clue, other than “more than what we’ve seen already!” A few months back, we showed the following chart that highlights the seasonal tendencies of gold.
Sure enough, we got the May rally that this chart suggests, and now we’re into the weak months for gold. A mid-July rally? Could be, but don’t count on it. The bigger picture is the likelihood of sideways-to-lower prices for the next month or two and therefore–patience for the buyer.
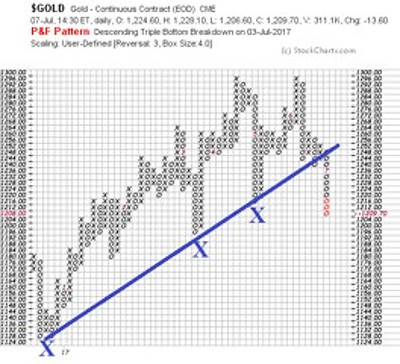
In terms of price, here’s a P&F chart with a few guideposts. The first big X, working back from where we are now, shows support around $1216 – an area we’ve already blown through.
The next X, and support, comes in around $1190-$1200. That makes sense, as there’s usually support for a falling market at big numbers, e.g. $1200. If that doesn’t halt gold’s decline, then we can reasonably expect a run at the $1125-$1130 area, where the last X is.
Not shown on this rather short-term chart is 2015’s low of $1045. If gold really is in a bear market, it should eventually challenge that area, which is its post-bull market, 7-year low.
On the other hand, gold really needs to break above the very important double top around $1300 before we can seriously talk about a new bull market there. Anything less is just, well – market noise. For our readers, all this translates into not being in a hurry to buy more gold.
As for silver – oy veh! It has already blown through support at the equivalent of all of those Xs on the gold chart. Another way to say that is: Silver is below its lows of late-2016, while gold is still well above its late-2016 lows.
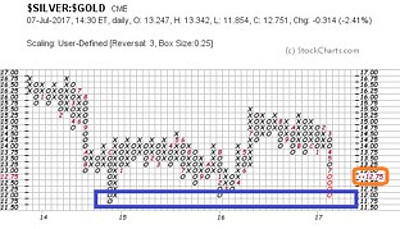
We see silver’s weakness compared to gold in the above relative strength chart, where the ratio has run down to about where it was in 2014 and again in 2016.
A cautionary note about where we are now, with those red zeros: Last week there was basically an erroneous trade or trades that instantly sent silver down a huge amount. It immediately rebounded, but the damage had been done on the charts, which still show silver with an “artificial” low around $14.30 and this ratio down to 12.00 to 1.
Thus, we should mostly ignore that and instead use 12.75 as the “real” ratio. But even that, which translates into one ounce of silver being worth 0.01275 ounces of gold, creates a negative chart pattern (see the quadruple bottom silver broke in May?) and doesn’t really bode well for silver.
A quick recap, then: Gold appears to be firmly in an intermediate-term downtrend, probably part of its longer-term bear market. At the least, the post-2013 (when gold’s bull market ended) period of deceptive, up and down moves continues -– as we suggested it might for many years.
Still, love gold and thinking about buying more? (Like me!) Then be patient and look for signs of bottoming at prices below where they are now.


