

For those looking to trade gold bullion, we suggest the SPDR Gold Shares ETF (GLD). Purchasing the ETF is an easy way to participate without holding the physical commodity, notes Bonnie Gortler in Signalert's Systems & Forecasts.
GLD tends to be trendy, once it establishes its direction. The top portion of the GLD chart below shows the weekly active trend channel in effect (blue lines).
GLD bottomed at $107.00 on Dec. 15, 2016. GLD penetrated the high on April 4, 2017n at $123.07, slightly breaking the downtrend from its peak (orange line) on July 5, 2016, which appeared to be a breakout at the time.
Instead, the breakout was false as GLD stalled at the middle channel, not powering through. GLD fell for five weeks to a low of $114.80 then turned up, holding well above the lower channel at $111.00 and above the low at $114.80.
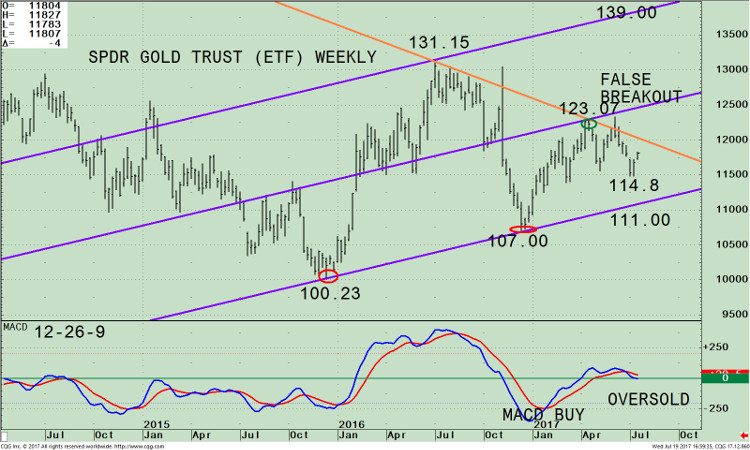
If GLD closes above the high at $123.07 (green circle) this time, GLD would likely be a true breakout. The potential upside target is $139.00. A close below the lower channel support at $111.00 would negate my bullish outlook.
The lower portion of the chart is the 12-26-9 MACD, a momentum indicator. MACD gave a buy from an extreme oversold condition as GLD rose.
On the latest pullback MACD penetrated 0 and has now turned slightly below 0. Any short-term rise in price now would turn MACD up and form a positive double bottom formation. This would imply further gains over the intermediate term (weeks-months).
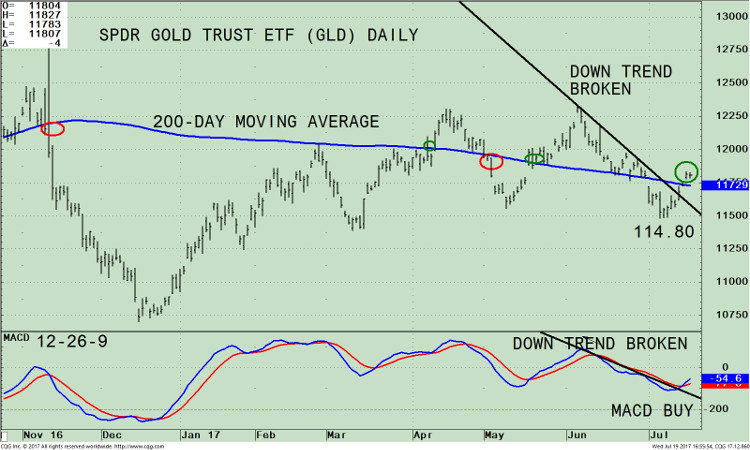
The top portion of the GLD chart above is the daily price with a 200-Day Simple Moving Average (blue line). The 200-day moving average is a common technical indicator which investors use to evaluate the price trend.
Very simply put, it’s the average of GLD closing price over the last 200 days. If the price of the security is above the moving average it’s bullish (green circles). If the price is below the moving average, it’s bearish (red circles).
Notice how on 07/18/17 GLD is above its 200-day moving average. In addition, GLD has penetrated the down trend (black line) suggesting further gains are likely in the near term.
The lower portion of the chart is the 12-26-9 MACD, a momentum indicator. MACD has generated a fresh buy together with a downside trend line break. This is a favorable development for GLD.
In sum, another buying opportunity for the gold bullion ETF is here. GLD is above its 200-day simple moving average and has successfully tested it weekly low. As long as GLD is above $111.00, look for GLD to trend higher.
Subscribe to Signalert Asset Management's Systems & Forecasts here...


