The US Dollar Index (DXY) still likely has some unfinished business to the downside prior to once again revisiting January highs, says Mike Golembesky, an Elliott Wave analyst who covers volatility indexes and forex.
The US Dollar Index (DXY) continued to move lower this week having lost another 1.4% from the previous week’s close. This continued move lower came after the DXY had already lost over 8% from the highs that were struck in January.
The dollar is still getting hammered on both the charts and in the media. Meanwhile, the DXY is now coming into a fairly strong support zone that should ideally provide at least some temporary relief from the onslaught that the DXY has seen as of late.
Anecdotal and other sentiment indications
Last week I had written about the news that was all over the financial press claiming that the dollar was down because the Republicans were unable to be able to pass their health care bill. I noted how the pundits were claiming that this was evidence that the “Trump Trade” was breaking down and that the continued uncertainty in the White House would surely cause the dollar to continue to fall lower.
This week I am reading that not only do the Republicans need to get their act together to allow the dollar back on solid ground but that U.S. Treasury yields must also move higher before the dollar has any chance of bouncing. This is supposedly due to the U.S. political situation weighing down on yields which were then in turn not allowing the dollar to bounce.
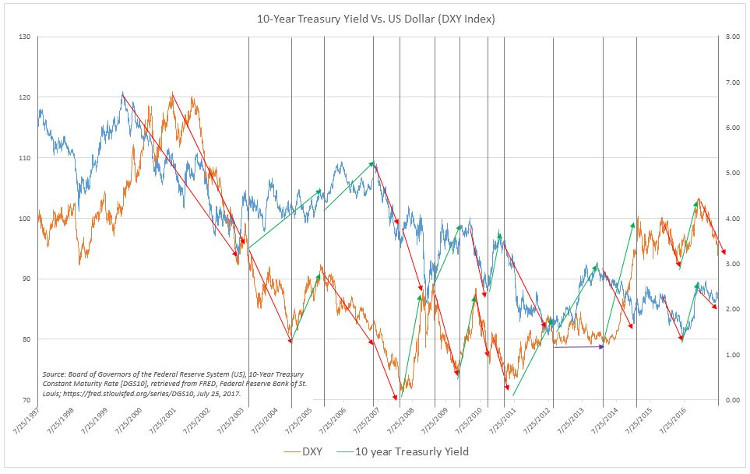
Well, even if we were to believe the first argument that the American politics was weighing down on U.S. Treasury yields, one simply has to look at a chart. There is no correlation between Treasury yields and the value of the dollar on either a long or even a short-term basis. Sometimes they move together and other times they don’t.
You may be serious about trying to determine what is going to happen next in the market. You can listen to the pundits attempt to assign causality to something that has nothing to do with the markets or correlations that clearly do not stand the test of time. Wouldn’t it be much easier to simply analyze the market for what it really is and just allow sentiment to speak?
Price pattern sentiment indications and expectations
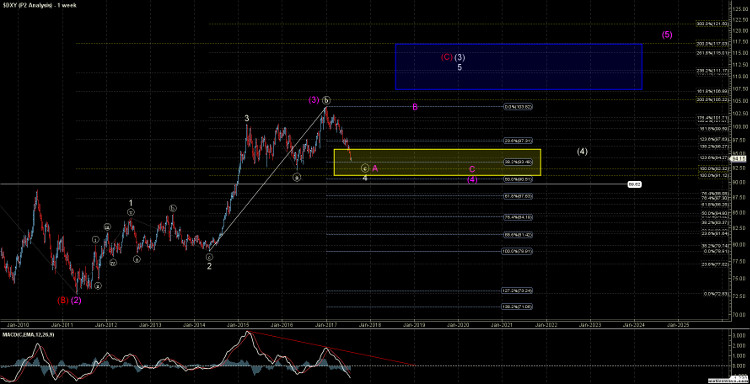
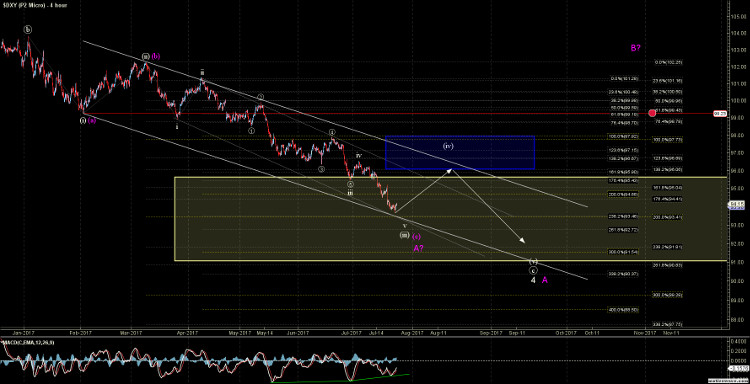
Last week I discussed the bigger picture outlook on the DXY Index and as we have only moved down about 1.4% since that writing really nothing has changed in this bigger picture perspective. What I am looking for on the DXY Index in the near term is to see a local bottom for wave (iii)/(c).
The 93.40/50 area on the DXY chart has some significant Fibonacci levels should ideally act as near term support for the DXY. If we are able to hold this 93.40/50 area and move higher then, I will be watching the 96.06 -97.73 as the next major pivot zone on the DXY Index.
If the DXY is able to break through the upper end of this resistance level at 97.73, then it would be the initial signal that the index has struck a larger degree bottom and may be on its way to at least re-testing the January highs with the potential to see a larger move back over the January highs. While on the other hand, holding within the resistance zone and under the 97.73 level would signal that we still have at least one more swing low to go prior to seeing a more sustained bottom in the DXY Index.
So, although I am looking for a local bottom and a near term bounce on the DXY, unless and until we are able to see a strong move back up through the 97.73 level, the DXY still likely has some unfinished business to the downside prior to once again revisiting those January highs.
See charts illustrating the wave counts on the DXY.


