

The monthly S&P500 Emini futures candlestick chart has been in a strong bull trend for 8 years. The odds still favor higher prices. But, only experienced bulls should buy here because the risk of a 3-month pullback is now high, asserts Al Brooks.
Monthly S&P500 Emini futures candlestick chart:
Strong bull trend, but parabolic wedge buy climax
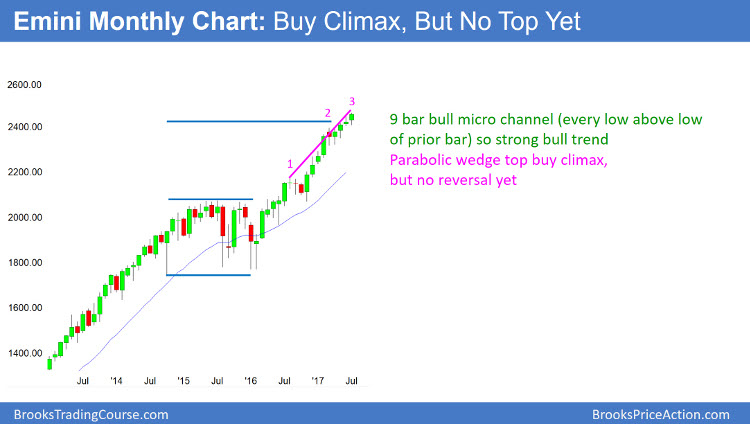
The monthly S&P500 Emini futures candlestick chart had its 3rd consecutive bull trend bar after the April High 1 buy signal bar. However, the 18-month rally is in a tight bull channel and has had 3 legs up. This is, therefore, a parabolic wedge.
The monthly S&P500 Emini futures candlestick chart has been in a strong bull trend for 8 years. In addition, it has been especially strong over the past 18 months. Furthermore, it has been extremely strong for 4 months. Whenever a bull trend becomes unusually strong late in the trend, the breakout is more likely an exhaustion move than the start of a new, stronger leg up.
That is the case here. Yet, buy climaxes can last far longer than what seems reasonable. The bears have neither a top nor a reversal down. Hence, the odds still favor higher prices. But, only experienced bulls should buy here because the risk of a 3-month pullback is now high.
Minor reversal likely
Since the 18-month bull channel is tight, the odds are that the 1st reversal down will be minor. Hence, the bulls will probably buy it within about 3 bars.
Consequently, the odds are against a trend reversal without the bears 1st getting at least a micro double top.
That will require both a small selloff and a test back up. Since this is a monthly chart, the downside risk is small for at least several months.
Weekly S&P500 Emini futures candlestick chart:
Extreme buy climax
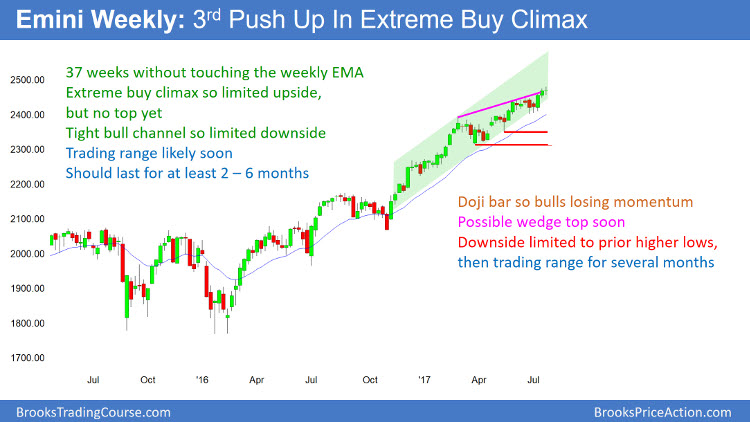
The weekly S&P500 Emini futures candlestick chart has not come close to its 20-week exponential moving average for 37 weeks. This is both a strong bull trend and an extreme buy climax.
The weekly S&P500 Emini futures candlestick chart has never been this overbought in its 18-year history. I say that based on how long it’s been far above its moving average. While there is no reversal down yet, this is a dangerous time and price to buy.
For several months, the odds favored a pullback to below the weekly moving average, which meant a 100–150 point pullback. However, as a buy climax becomes more extreme, the probability of a deeper correction increases. Consequently, the risk of a 200 point or 10% correction by the end of the year is increasing.
This week had a bear body. It, therefore, is a signal bar for the bears next week. Yet, if next week ends up as a bull bar, it would erase the bearish potential. The bears need a strong entry bar next week to convince traders that the correction has begun. Without it, the odds still favor sideways to up.
Daily S&P500 Emini futures candlestick chart:
Parabolic wedge top trying to reverse down
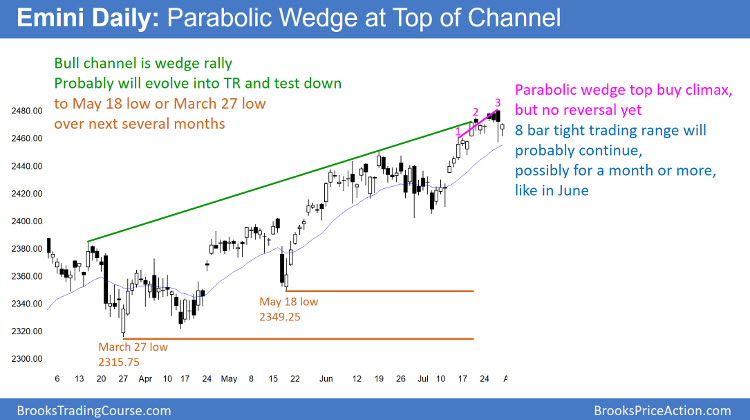
Friday is a bull inside bar in a bull trend. It is a buy signal bar for Monday. However, the Emini is in an 8 bar tight trading range. Therefore the odds favor more sideways trading for at least several days, instead of a successful bull breakout.
The daily S&P500 Emini futures candlestick chart is pulling back from a parabolic wedge rally. The odds are that it will continue mostly sideways this week. It might stay sideways for a month like it did 4 other times this year (March, April, May, and June).
Since Friday was a bull inside bar, it is a buy signal bar for next week. Yet, because of the 8 bar tight trading range, the odds are that any move up or down next week will probably last only a few days.
Because the weekly and monthly charts also have buy climaxes, the odds of a 2 to 3-month correction are high before the trend continues much higher. The issue is when it will begin.
Until there is a top and a reversal, the Emini is likely to continue sideways to up. Since most reversals fail, the probability is that this one will as well. Yet, the odds are getting better for the bears.


