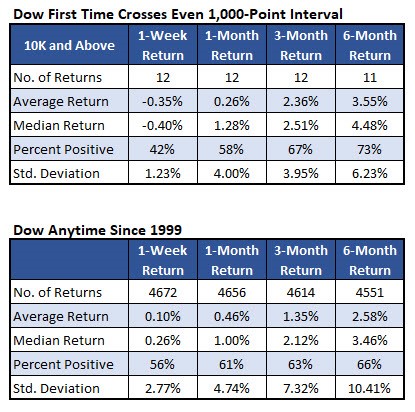

While the index tends to underperform one week and one month after a cross, it tends to outperform three and six months out. Volatility tends to be lower, writes Andrea Kramer, analyst with Schaeffer’s Investment Research.
Get Trading Insights, MoneyShow’s free trading newsletter »
The Dow Jones Industrial Average (DJIA) crossed above the 22,000 level for the first time ever, with help from Apple earnings. The blue-chip index has now taken out four 1,000-point intervals just since Nov. 22, when the index crossed above 19,000 for the first time. Below, we'll take a look at how the Dow tends to perform after these huge round-number feats.
Until now, the Dow had never crossed above four millennium levels in the span of a year, though there were several times during the 1990s tech boom where the index took out three in relatively short order.
The DJIA also took out three 1,000-point markers between October 2006 and July 2007, just months before the financial crisis, according to data from Schaeffer's Senior Quantitative Analyst Rocky White.
And the index took out three levels again in 2009 (8K to 10K) and 2013 (14K to 16K), though most of those are not listed in the chart below, which measures only the first time the Dow crossed a millennium marker.
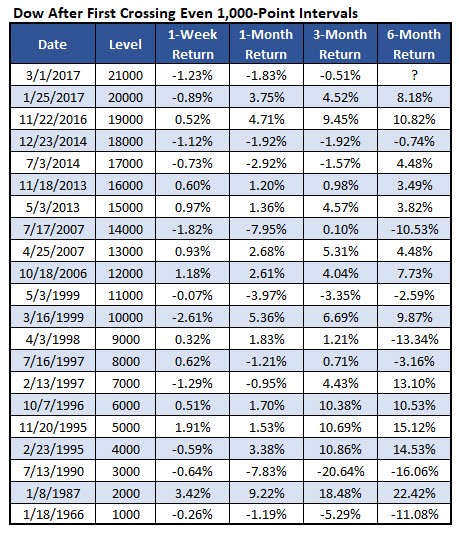
However, it should be noted that as the Dow gets higher, it becomes easier to cross a 1,000-point marker. For instance, the DJIA had to increase 25% to get from 8,000 to cross above 10,000. For the Dow to go from 20,000 to 22,000, meanwhile, it needs just a 10% move.
Below are Dow returns after the first time crossing a 1,000-point marker, going back to 1999, when the index first moved into five-digit territory (taking out 10,000). While the index tends to underperform one week and one month after a cross, it tends to outperform three and six months out.
Specifically, the average three-month return of 2.36% after a cross handily exceeds the Dow's anytime three-month average return of 1.35%, going back to 1999. And the index has been higher 73% of the time six months after a cross, with an average return of 3.55% -- much better than usual. In addition, it's also worth noting that volatility -- as measured by standard deviation -- tends to be much lower than usual after a cross of millennium markers.