

We have experienced a typically strong post-election July. The month lived up to its reputation as a solid performer in post-election years, observes seasonal trading expert Jeffrey Hirsch, editor of Stock Trader's Almanac.
Get Trading Insights, MoneyShow’s free trading newsletter »
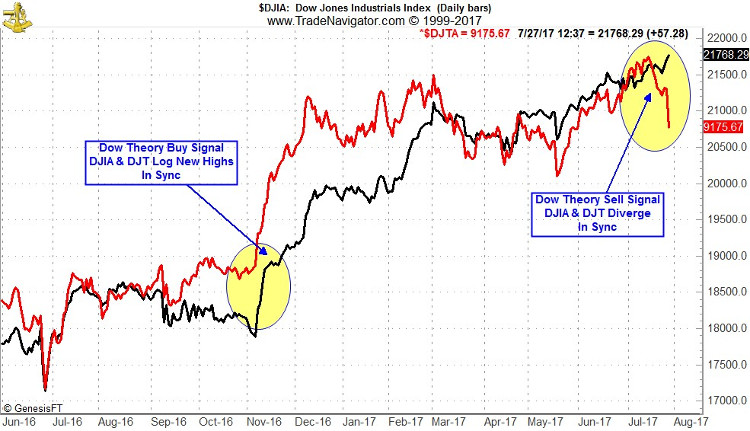
With VIX low, sentiment high and stocks up, the time is nigh for the August-September slide. In addition we now have a Dow Theory Signal as the Dow Transports have just fallen rather sharply, down 5.7% in the past two weeks.
All this weakness in the Transports has occurred while the Dow Industrials continues to log multiple new highs this month.
This lack of confirmation or synergy between the two oldest U.S. market benchmarks just triggered a Dow Theory Sell Signal. When the backbone of our economy that transports goods across the nation does not perform well it is an indication that there is underlying economic woe.
It is not always right and like everything else it is subject to interpretation, but it does have a solid track record and is worth heeding here as our other indicators are pointing to a summer selloff around the corner.
In the face of all this overvaluation, frothy sentiment and the upcoming seasonal weakness we usually get in August and September, we are pleased to already be in a rather defensive risk off position.
Sentiment as measured by the trusty Investors Intelligence Bullish and Bearish Advisors % continues to move evermore bullish to over 60% bulls and down to under 17% bears with an expanding spread between bulls and bears to near-peak levels of 43.7%.
These are the levels associated with market corrections. At the same time volatility remains super low, but ticking up from historic lows under 9 intraday. If volatility begins to pick up and sentiment retreats look for the market to turn lower.
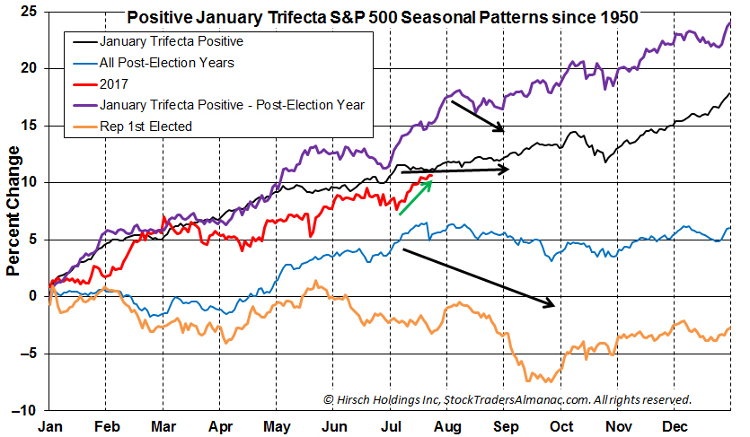
Concurrently, 2017 continues to track the 1-year seasonal pattern of Positive January Indicator Trifecta (Years when our 3 January indicators, January Barometer, First Five Days and Santa Claus Rally are all up) and Post-Election Years.
As you can see in the chart below this suggests further upside this year, but not before a pause or more serious pullback during the August through October timeframe.
The beginning of August is notoriously weak as investors, traders and money managers take off en masse on vacations.
This is followed by a mid-month surge then a weak close, September trouble and the feared syndrome called Octoberphobia. So keep your powder dry, sit tight and take some risk off before the summer market swoon.


