

If heading into the dot-com era was a stock market bubble, what is this today? Earnings reports, vehicle sales, and local tax receipts predict a recession, writes Dennis Slothower editor of Wall Street Underground Profits.
Get Trading Insights, MoneyShow’s free trading newsletter »
Boeing (BA), Apple (AAPL), and McDonald’s (MCD) stock performance — or 10% of the Dow 30 companies — represent 50% of the entire performance of the Dow’s last 2000-point advance.
While it may not seem like it, based on the Dow 30, the average company stock is down 0.78% the day they report corporate earnings, which is the worst since Q1 of 2014, according to the Wall Street Journal.
The story this year has been how the large companies with the most shares outstanding that are weighted the most in the S&P 500 (SPX) have outperformed the rest of equal weighted companies within the S&P 500.
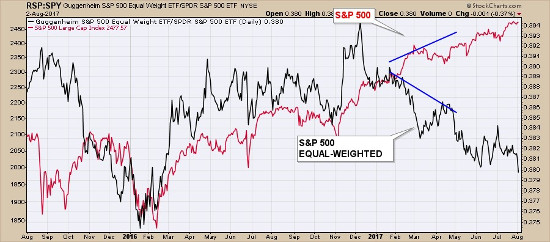
The divergence is breadth taking (pun intended) and it reveals the internal underlying weakness in the market that you do not hear about in the news.
As of Tuesday, according to Bloomberg, 314 of the S&P 500 companies have reported earnings and of those, 174 had reported profits and sales that beat analysts’ expectations (phony game because they lower the expectations right before they report).
Five days later, the same stocks performed slightly worse than the rest of the market. As a general rule, since the year 2000, shares reporting better-than-expected earnings have risen about 1.6% more than the market on the day of the announcement.
However, according to Bloomberg, the last time stocks on average failed to jump on good earnings was the second quarter of 2000, 17 years ago!
Yet there might just be a simpler answer as to why this is the case.
There is very little cash on the sidelines. The herd is invested.
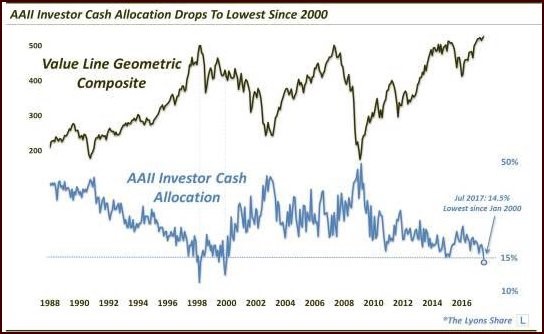
We also have to go back 17 years to the first quarter of 2000 to find a period where cash allocations are this small. There isn’t a lot of cash to drive capital higher going into the weak season of August, September, and October.
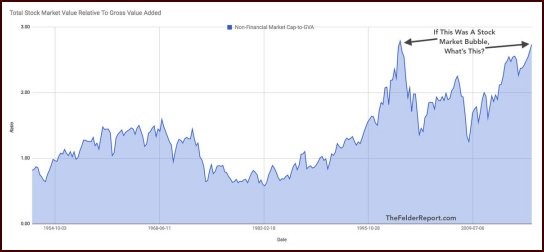
From valuations’ perspective going into August, stocks are as overvalued as they were going into March 2000 of the dot-com bubble days.
This narrowness of market breadth, when cash levels are historically low just as we push into the seasonally weak period of August, September, and October, should be well noted by investors as well.
The chart asks a great question: If heading into the dot-com era was a stock market bubble, what is this today?
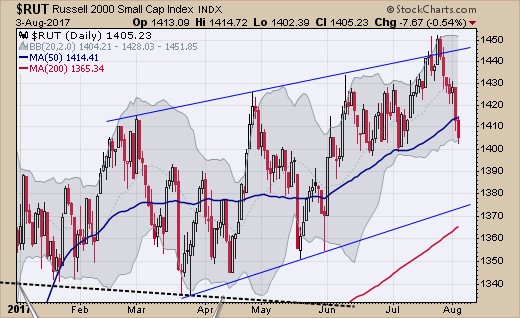
Given the recent earnings going into August, the Russell 2000 Index (RUT) peaked in mid-July and has made very little progress this year. This is really no surprise given the Republicans’ failure on repealing Obamacare.
You might find this an interesting point. JP Morgan Chase (JPM) earned $26 billion over the last four quarters but it has plowed back $27.6 billion, or 106% of its income, into share buybacks and dividends.
In fact, the 10 largest banks combined, on an annualized basis, will plow 99% of their earnings into share buybacks and dividends. Is it any wonder we have such distortions?
Corporations playing this game will soon find horrendous losses at the next bear market. Until the Glass-Steagall Act is put into place and real bank reform is put into place that separates investment banks massively leveraging capital of commercial banks, history is bound to repeat itself.
Automotive canary is chirping
We learned that July saw the biggest year-over-year decline in U.S. vehicle sales so far this year. U.S. sales of new cars and trucks fell 7% to 1.4 million in July, according to Autodata Corp. It was the seventh straight month of lower sales, and the biggest percentage drop this year.
Historically, declines in new car sales by more than -2% on a year-over-year basis have always been followed by recessions. Car sales started to plunge when the Fed began jacking up interest rates, especially since December 2016.
Another recession worry is that state and local government current tax receipts (taxes on corporate income) are plunging like a rock!
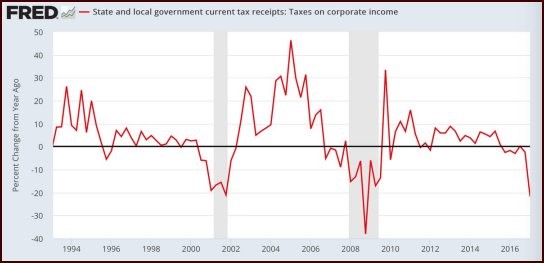
The last two times tax receipts were plunging this bad we were in the Dot-com Recession and the Great Recession! This chart suggests it won’t be long now before reality strikes again.


