

This weekly trade idea using the VXX, shows how Fibonacci Pinball and Elliott Wave works across all markets and all instruments,asserts Avi Gilburt and Mike Golembesky.
Get Trading Insights, MoneyShow’s free trading newsletter »
Many have asked me to explain how our Fibonacci Pinball method of Elliott Wave analysis works. So, this week, I am going to show you a real-time example of how one of our analysts used it to trade the equity market decline we experienced this past Thursday.
On August 10, the iPath S&P 500 VIX Short Term Futures ETN (VXX) closed up 14% from the closing price on August 9. If we count the after-hours data, this move was actually closer to 20%.
More impressive than the move higher itself was how well the move followed our Fibonacci Pinball guidelines on its way higher. This adherence to our guidelines allowed us to not only enter a trade with pre-defined stops and target levels but also allowed us to manage the trade during the rally, maximizing returns while minimizing risk.
Recent real-time example
While most of the focus over the last several days was on the increased rhetoric between North Korea and Donald Trump, our focus was purely on the price action of the charts. The trades that we entered were done so based on the rules of Elliott Wave and the guidelines of Fibonacci Pinball.
We entered, managed and exited all of the trades using this methodology and nothing else. There was absolutely no guessing or questioning how to enter, manage or exit this trade. No exogenous news event played any role whatsoever in how we traded the VXX on August 9 through August 10.
Several charts show how we entered the trade using the Fib Pinball guidelines on August 9. We then managed that trade as the VXX struck our targets along the way throughout the day on August 10.
These entry and exit trade alerts, along with updates for stop management, were all posted in real time in the VIX Service at ElliottWaveTrader.
Specific trades and trade management
The chart below was posted in the VIX room on August 9 at 2:42 pm:
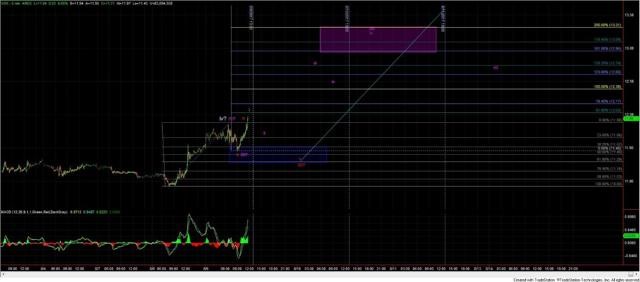
When this chart was posted this comment was noted:
“The most bullish interpretation of this is that we are in a (1)-(2) i-ii to the long side here on the 5-minute chart. This might give another setup to enter long upon a corrective retrace tomorrow…I would likely look to add to a long position in the VIX portfolio if we can see a corrective retrace from around current levels. This may not occur until tomorrow though so need to wait and see.”
That bullish interpretation was that the VXX was closing in on a textbook fib pinball (1)-(2) i-ii setup. These (1)-(2) i-ii setups are some of the most reliable and most profitable of all setups that we find in Elliott Wave analysis.
At the time of this posting, we still did not yet have confirmation that the setup was valid. We were, however, able to prepare to enter a trade based on the patterns that were evident on the chart while waiting for confirmation which would allow us to pull the trigger on a trade.
The chart below was posted as a Trade Alert on August 9 at 3:51 pm:
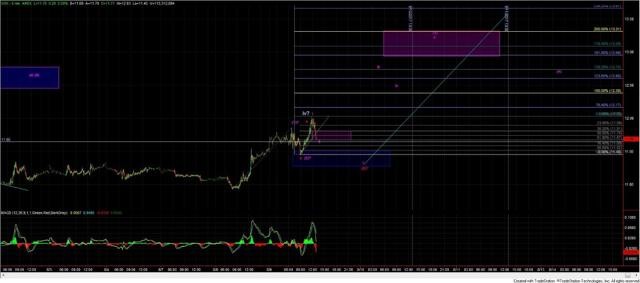
When this chart was posted this comment was noted:
“Grabbing some of this week’s calls [8/11 12 strike calls] for the potential purple path…”
As is visible on this chart the wave i of (3) did end up stopping right at the 61.8 extension almost to the penny confirming our very bullish (1)-(2) i-ii setup. The VXX then moved down correctively right into the 61.8 retrace of that wave i of (3). This was the ideal entry point for a trade to the long side with potential targets in the 12.95-13.31 zone.
Therefore, our Fibonacci Pinball guidelines not only gave us a good entry, stop and target levels, but provided us with a good idea as to the timing of when that move should occur.
After the close on August 9 the VXX did break through the ideal support levels for the wave i of (3) but it did not invalidate the setup as it did hold the 11.45 low even in after-hours trading. Therefore the trade setup was still valid going into August 10.
On August 10 the VXX gapped higher giving us the initial signal that the (1)-(2) i-ii setup that was in place on August 9 was indeed following through.
Below the chart is marked up with how the trade was entered and where the exit points where based on our Fibonacci Pinball Guidelines:
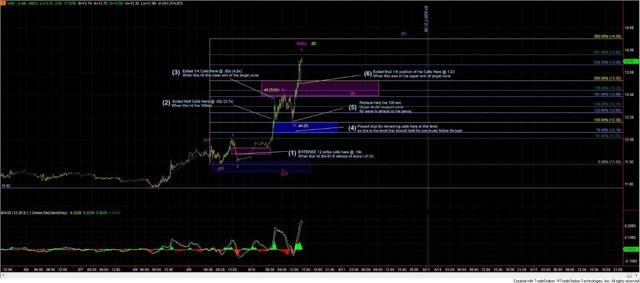
1. The trade was entered here as this was the 61.8 retrace after getting a (1)-(2) i-ii to the upside.
2. The VXX hit the 1.00 extension (which is our first target in Fibonacci Pinball) at about 10 am. This 1.00 extension is a significant inflection point so as the calls were trading at 2.7x half were closed here. At 2.7x all of the premium paid for the calls was removed so even if the VXX failed at this inflection point and spiked lower leaving those calls at 0 the trade still would end up profitable.
3. The VXX cleared that 1.00 extension inflection point fairly easily and then hit the lower end of the target zone for wave iii at 12.96. Another 1/4 of the calls were exited here at about 4.5x as we were now in the lower end of the target zone.
4. After the VXX made another smaller retrace and higher high I moved the stops up for the remainder of the calls to just over breakeven as our Fibonacci Pinball guidelines provided support levels of 12.38-12.16 zone. A break of this zone would signal that the VXX was not going give further follow-through on the impulsive count.
5. The VXX retraced almost to the penny of the upper end of the support zone for wave iv and then shot up higher in impulsive fashion.
6. While I was fairly confident that the VXX would hit the ideal target of 13.30 based on the micro structure, I exited the remainder of the calls @1.20 or 6.3x as we were only 5 minutes away from the regular hours close. The VXX did indeed hit 13.30 in the regular time hours and then exploded higher in the AH giving us a very extended wave v of (3).
So with an entry price of .19 and an average exit price of .77, we ended up with 4x trade on the VXX in one 24-hour period all while very conservatively managing the risk of that trade. Again the only tools we used to enter, manage and exit this trade were those of Elliott Wave and Fibonacci Pinball.
While this example is using the VXX, Fibonacci Pinball works across all markets and all instruments. Although we have seen it time and time again, the precision and power of this tool never ceases to amaze us. So when the market provides us with impulsive wave structures, there simply is no better method which can pinpoint targets and support levels than Elliott Wave and Fibonacci Pinball.
This article was written with Mike Golembesky, who was the analyst who managed this trade. Mike also writes about forex and the Dow Jones. I highly suggest you follow Mike’s analysis on Seeking Alpha and MoneyShow.com.
See page where you can expand the charts mentioned in this article.


