I remain bullish the metals complex, yet on alert for one more pullback before the market finally breaks out for a rally into the fall of 2017, writes Avi Gilburt, a widely followed Elliott Wave technical analyst and author of ElliottWaveTrader.net.
Get Trading Insights, MoneyShow’s free trading newsletter »
Reading most metals analysis in 2017 has been like watching a tennis match with the analysis going back and forth over the net between bullishness and bearishness. As the market reaches its highs, analysts turn bullish, and as the market reaches its lows, analysts turn terribly bearish. And, when the sentiment of the market has reached these extremes, it has marked the point when the markets have turned.
As I have tried to warn all year, anyone who uses trend lines as their primary method of analysis has been terribly whipsawed, as the metals love to exceed trend lines right before they reverse strongly. This is one of the biggest reasons many have become terribly bullish at the highs (right before the market has reversed), and terribly bearish at the lows (right before the market reversed as well).
So, does your neck hurt from all this back and forth during this whipsaw?
While I had expected the set-up we saw a little over a month ago to break us out of this range, the market clearly had other ideas. But, the one thing that you have often seen of our analysis is that we recognize the bullishness at each of the highs representing potential pullbacks in the market, whereas the bearish lows were the time to start looking higher.
And, we have done this quite successfully through the years, as I do not think we missed a single low point in this market in years. In fact, I have even stated my bullish perspectives at those lows despite the pervasive bearish sentiment in the market, and even while being attacked for turning bullish by members of my own trading room.
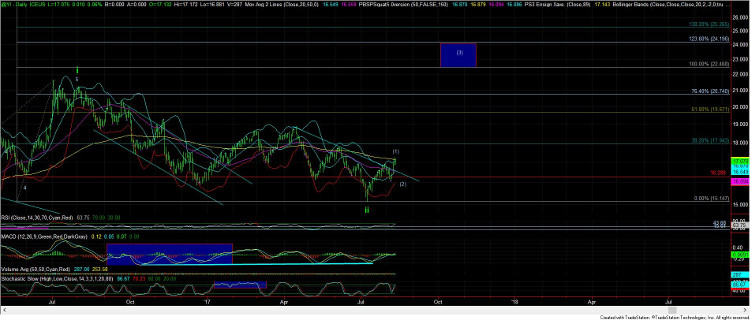
Last weekend marked another smaller degree point of bearishness. As we went into the weekend, the market had pulled back right into the support region we were noting on our charts. In fact, I was keying in most on silver, wherein I noted:
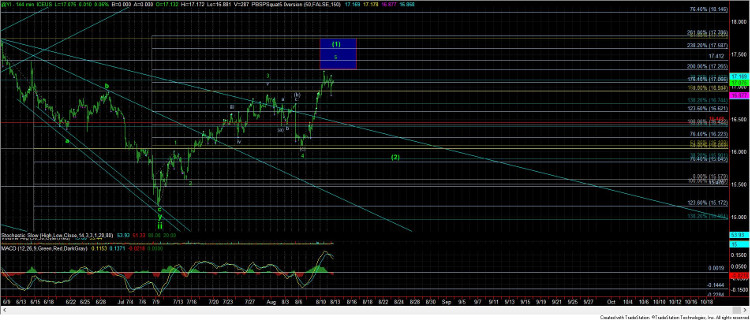
As many of you know, I like it when charts provide us textbook structures. Thus far, silver still needs one more rally to provide us with a more solid 5 waves up off the recent lows. And, as long as we hold the 16.10-16.20 support region, I can still see the potential for a higher high in silver for 5 up.
Two weeks ago, silver struck a low of 16.10, and rallied right up to the blue box target I have had on my chart for weeks, with the bottom being 17.26. The high for silver was 17.23.
Now, we are at an inflection point. The market is going to have to make a decision. My primary perspective has been that, once this rally completes, we see a sharp decline in the complex, to scare out investors one more time, making them believe this is yet another fake out, especially when you consider that all eyes are on a supposed break out of a downtrend line in silver.
As I had warned two weeks ago during my mid-week metals update:
Lastly, I want to address something that I know you will likely see a lot written about today and tomorrow. Silver has now taken out a multi-month downtrend line, as you can see from the attached daily chart of silver. That often gets trend channel followers quite bullish. But, as I have warned many times over, the metals complex loves to exceed channels to get participants either very bullish or bearish, just before it strongly reverses. For this reason, I also see the potential for the (1)(2) set up I have been posting about for weeks. So, until you see silver break out through the 17.80 region with strong buying volume, I want you to strongly consider this potential as what will play out in the coming week or so.
And, for now, this is still my primary expectation. But, please do not mistake that for me being bearish. Rather, I have been and am still quite bullish of this set up, as long as we do not break the July lows.
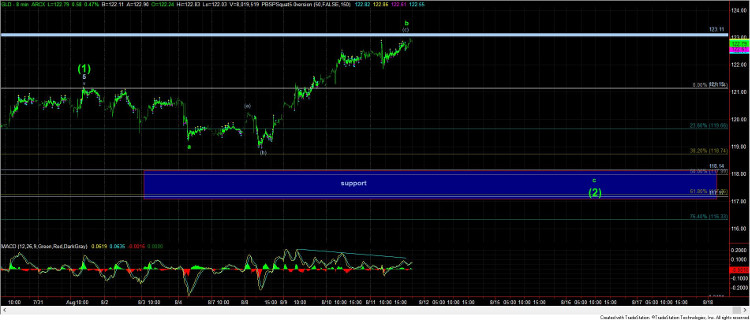
As far as the SPDR Gold Shares ETF (GLD) is concerned, it clearly pushed through the 122 resistance I noted last weekend, however, it has not done so with much volume. One of the things we often see within 3rd waves is much stronger buying volume. It is one of the signs of a 3rd wave, which we have not seen just yet in GLD. Moreover, my expectation was that this would be an expanded b-wave high, which is supported, thus far, by the negatively diverging technicals on the attached 8-minute chart. Now, while GLD has exceeded its initial resistance a bit (and what else is new with GLD), it still has not shown any indication that this break out is real. Therefore, I maintain the same expectation in GLD that I do for silver, and will be looking for one more drop before the fireworks begin.
But, remember. When dealing with fireworks, all it takes is one spark, and the entire box can be ignited. The metals market is in no different position right now. It does have the potential for a direct breakout, and if we should see silver take out its blue box overhead with strong buying volume, do not stand in its way, since it means someone has lit the match, and it will likely have begun the heart of its 3rd wave higher.
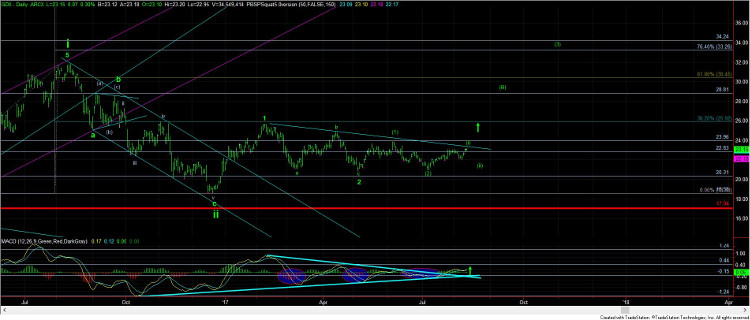
As far as GDX is concerned, as I have been saying for the last several weeks, the micro structure is truly messy on this rise. While GLD and silver have been displaying truly ideal Elliott Wave structures, Market Vectors Gold Miners ETF (GDX) has been an overlapping mess. So, the question of how to count the micro structure has become a bit of a challenge. Rather than provide you with multiple count potentials, I am going to provide resistance and support levels. Currently, the resistance for GDX resides between 23.60-23.96. As long as we remain below that resistance region, I am expecting another pullback in the complex. However, should we see a direct break out of that region, then you should set your stops just below the 22.83 region, for if it is a true 3rd wave break out from that point, we should not see the 22.80 region again.
In summary, I remain bullish the complex, but am on alert for one more pullback before the market finally breaks out for a rally into the fall of 2017.
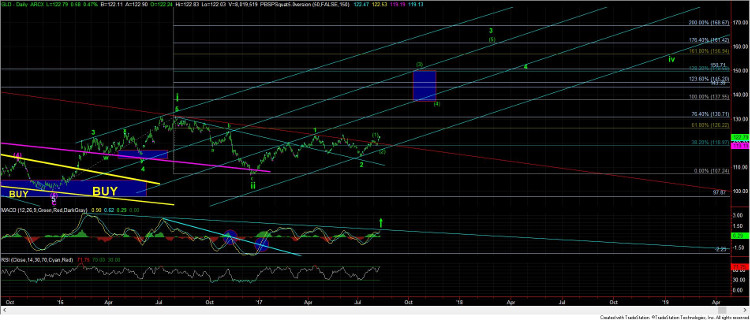
See charts illustrating the wave counts on the GDX, GLD, and Silver Futures (YI).
Subscribe to Elliott Wave Trader here