

All trading ranges are breakout mode environments with both reasonable buy and sell setups. That is likely here. Because of how long the channel up lasted, the trading range could last 6 months or more before a breakout up or down, asserts Al Brooks.
Get Trading Insights, MoneyShow’s free trading newsletter »
Monthly S&P500 Emini futures candlestick chart:
Trump is catalyst for 5 percent S&P500 stock market correction after parabolic wedge buy climax
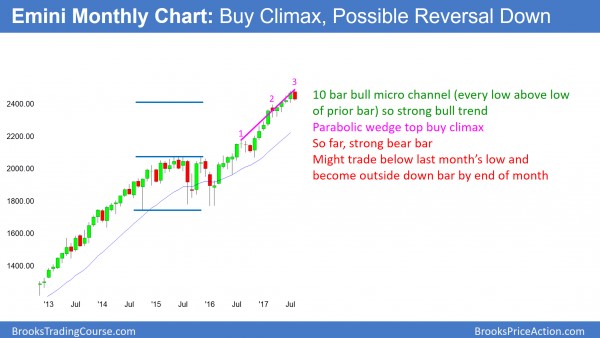
The monthly S&P500 Emini futures candlestick chart has had 10 bars where the low of each bar is above the low of the prior bar. This is a bull micro channel. Since it has 3 legs up in the tight bull channel, it is a parabolic wedge buy climax. If the current bar closes near its low, it will be a sell signal bar for next month.
The monthly S&P500 Emini futures candlestick chart is in a strong bull trend. Yet, a 10 bar bull micro channel is extreme strength in a trend that has lasted about 100 bars. When a bull trend shows a great increase in strength late in the trend, it is more often an exhaustive buy climax than the start of another strong leg up. Therefore, the odds are that the bulls will soon take a break from buying for a few bars.
Since August traded above the July high and is now near its low, this month could become an outside down month. This would be a sign of strength for the bears. It would, therefore, increase the chances that the bulls are taking profits and the Emini will pull back for a few months.
Since a 3 month reversal in a bull trend is much more likely going to be a bull flag than a bear trend, the odds are that the bulls will buy within a few months. Consequently, the selloff will then likely lead to a rally that will test this month’s all-time high.
Final bull flag
Since the monthly chart is around a measured move up from the 2014 – 2015 trading range, it is at resistance. When a trading range forms late in a bull trend, it usually is the final bull flag. However, the 20-month rally from the 1800 low of that range is in a tight bull channel. That is a strong bull trend, and therefore the odds are against an immediate reversal down to the bottom of that trading range.
However, if the Emini begins to go sideways for 5 – 10 bars (months), the bears will start to create a credible top. Since the odds are that the Emini will test down to the bottom of that 2-year trading range at some point in the next few years, the bears will look to sell the rally after the upcoming pullback. But, without the upcoming pullback and then at least a micro double top, the risk of a major reversal is small.
Consequently, the best the bears can probably get over the next few months is a pullback or a bear leg in what will become a trading range.
Weekly S&P500 Emini futures candlestick chart:
Turning down from an extreme buy climax
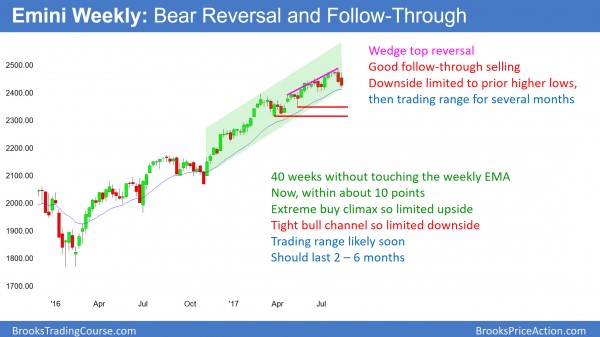
The weekly S&P500 Emini futures candlestick chart has not touched its 20-week exponential moving average in 40 weeks. It has reversed down strongly over the past 2 weeks, and it will likely continue down to test the May or March lows over the next few months. The tail on the bottom of this week’s bar is a sign that the bears are not as aggressive as they could be. This is consistent with the reversal probably being minor.
The weekly S&P500 Emini futures candlestick chart has never been this overbought in its 18-year history. It has not come close to its moving average in 40 bars, and that has never happened before. Consequently, this is unsustainable behavior. It is, therefore, an extreme buy climax.
Most buy climaxes result in about 10 bars sideways to down, and then a trading range. In addition, they usually test support. The obvious support is the 20-week moving average, which is now around 2412. However, most pullbacks to the weekly moving average fall at least 20 – 50 points below. That means the minimum goal based on the moving average buy climax is between 2360 and 2390.
Since the rally from the March low has had 3 or 4 legs, it is a wedge. A wedge rally usually corrects down in two or more legs. In addition, it typically tests the bottom of the wedge, which is the March low at around 2320. It often falls a little below. Consequently, a reasonable goal for the bears is a 2 – 3 month pullback to between 2300 and 2350.
The bull case
The 20-month rally has been in a tight bull channel. Therefore the 1st reversal down will probably be minor. Since the Emini has not touched its moving average in more than 20 bars (actually, 40 bars), there will be 20 Gap Bar bulls who will buy at the moving average. The bulls, therefore, expect a rally up from the moving average. That is also at the June 29 low, which is the most recent major higher low.
Normally, this would be the most likely outcome. The bulls would buy at the moving average, and the bull trend would then resume to a new high. However, because the buy climax is so extreme, the pullback will probably last at least 10 weeks, which is 2 – 3 months.
The bulls will try to buy at the support of the moving average and the June 29 low. However, it is more likely that the best they will get is a tight trading range, like in June. The odds favor at least one more leg down after that trading range.
Daily S&P500 Emini futures candlestick chart:
Strong bear reversal
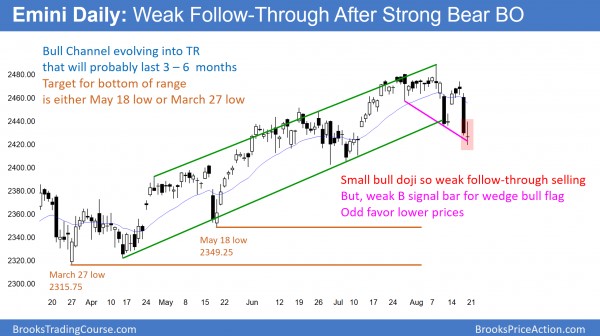
The daily S&P500 Emini futures candlestick chart had a big bear day on each of the past 2 Thursdays. This is the 1st time in the 20-month rally that there have been 2 big bear bars within a short period of time. Hence, it is a sign that the bull channel is probably evolving into a bear swing. The odds are that it will fall about 150 points over the next 2 – 3 months. Friday’s bull body was weak follow-through for the bears. The bulls see the selloff as a High 2 bull flag.
The daily S&P500 Emini futures candlestick chart had a strong rally in February. This was a bull spike. It then rallied in a bull channel since March. This is a Spike and Channel bull trend. It broke below the bull trend line this week. When a Spike and Channel bull trend reverses, it usually pauses about halfway down. That would be around the June trading range and 2400. However, the odds are that the selloff will test down to the beginning of the channel. Hence, this selloff will probably test the May or March lows between 2320 and 2350.
Friday had a close around its middle after the strong selloff Thursday. Friday is a weak buy signal bar for a High 2 pullback from the all-time high. While this is a buy setup for the bulls, the odds still favor lower prices over the next 2 months because of the weekly buy climax.
Yet, bulls will buy, looking for trend resumption up. However, they need to get a strong reversal up next week, or a series of bull bars closing on their highs. Otherwise, the bears will see the reversal as weak, like the rally at the start of this week. Consequently, they will sell again, expecting another lower high and then a new leg down. In addition, the bulls will sell out of their longs if the rally is weak.
Channels evolve into trading ranges
Once a Spike and Channel bull trend reverses to the start of the bull channel, bears take profits and bulls buy. However, after a 5% correction, the odds are that the Emini will have entered a trading range.
Remember the market cycle. A bull channel typically has a bear breakout and then evolves into a trading range. That is likely here. The channel is, therefore, a bull leg in what will become a trading range. Since the channel up lasted several months, the bear channel down to the March low will also likely last at least 2 months.
After a big move up and down, the market is confused. Traders will assume that the 1st reversal up will form a lower high. The selloff from that lower high typically bounces around the developing trading range low. At that point, there will be both a double bottom bull flag and a lower high major trend reversal. Here, that would also be a head-and-shoulders top. All trading ranges are breakout mode environments with both reasonable buy and sell setups. That is likely here. Because of how long the channel up lasted, the trading range could last 6 months or more before there is a breakout up or down.


