

The August 22 reversal up was very strong and was created by confident bulls. If they get stopped out, many will be hesitant to buy again. The weekly buy climax will likely need 2 – 3 months before the bulls will return, asserts Al Brooks.
Get Trading Insights, MoneyShow’s free trading newsletter »
Monthly S&P500 Emini futures candlestick chart:
Parabolic wedge buy climax
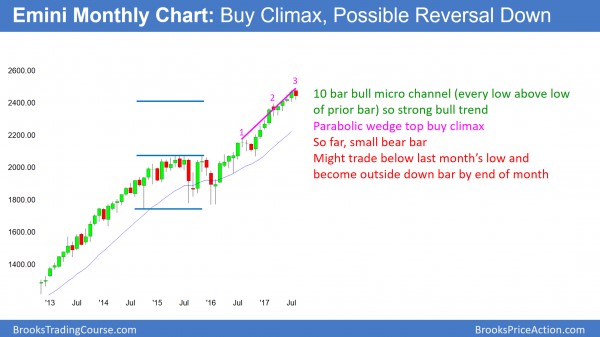
The monthly S&P500 Emini futures candlestick chart has a bear body so far this month. If August trades below the July low, it will be an outside down month. In addition, it is in a 20-month tight bull channel that has had 3 pushes up. This is, therefore, parabolic wedge buy climax. Finally, since every bar for the past 10 bars has a low above the low of the prior bar, this is a micro channel. When one forms late in a bull trend, it, too, is a type of buy climax.
The monthly S&P500 Emini futures candlestick chart has been in a strong bull trend for 8 years. In addition, it has rallied especially strongly for 20 months. The low of every bar for the past 10 months is above the low of the prior month. This is extremely strong buying. Since it is occurring late in a bull trend, it is likely too strong. Hence, it is climactic.
Yet, a buy climax in a tight bull channel only has a 20% chance of immediately reversing into a bear trend. A reversal usually requires a transition into 10 or more bars of sideways trading before traders become confident that the bears might be strong enough to take control. Consequently, the odds are that the best the bears can get over the next few months is a pullback and not a bear trend. A pullback means that the odds are greater that it will lead to an attempt to resume the bull trend instead of reversing it.
Possible outside down month
This month so far has a bear body. While it could rally over the final days and have a bull body, it would probably be a doji. This would be poor follow-through buying. Additionally, the 20-month rally is in a parabolic wedge bull channel, which is a buy climax. That therefore further increases the odds of a pullback beginning soon.
Alternatively, the Emini could trade below the July low by the end of the month. This is unlikely at the moment. Since it traded above the July high, that would turn August into an outside down month. That is a sign of strong bears. It would increase the odds that a 2 – 3-month pullback might be beginning.
How big might a pullback be?
A reasonable goal for the 1st reversal down into a bull flag is a 2 – 3 bar (month) pullback. It might test the March low. Therefore, the pullback could be 5 – 10%. If the pullback contains one or two big bear bars, or 3 consecutive bear bars, the odds are that there would be a 2nd leg down. Therefore the pullback could last maybe 6 months. If it then tests the high and falls back again, the pullback could last more than 10 bars.
Once a pullback lasts that long, traders begin to refer to it as a trading range. Since a trading range always has a reasonable buy and sell setup, the odds of a reversal down eventually could approach 50%.
Weekly S&P500 Emini futures candlestick chart:
Buy climax pulling back to the 20-week exponential moving average
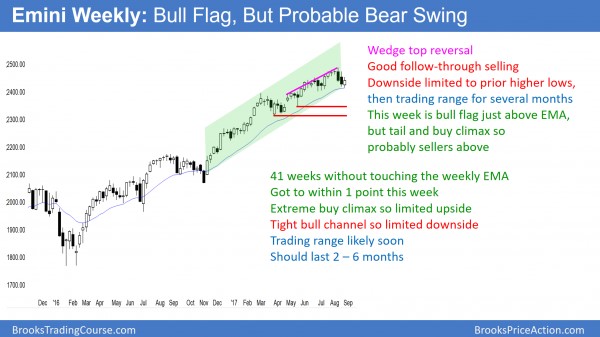
The weekly S&P500 Emini futures candlestick chart has been above the 20-week exponential moving average for 41 weeks. The bulls hope that this week was an adequate test of the average. If so, bulls will buy, since this would be a 20 gap bar buy setup. There has been a gap below the low of every bar and the moving average for more than 20 weeks. This means that the bulls have been so eager to buy that they have been buying above the average price. Many bulls will be eager to finally buy at the average price.
The weekly S&P500 Emini futures candlestick chart has been very unusual. It has never been this far above its 20-week exponential moving average for 41 weeks in its 18-year history. It is now very close to the moving average.
How does a moving average test take place?
If a trader looks at a weekly chart and the moving average is above the low of the week, he might assume that the Emini fell to the moving average and then rallied. Last week has been an example of how that is not always true. At the close of trading on August 21, the low of the week was 1 point above the average. It traded up strongly on Tuesday.
Remember that the average uses the current close of the bar in its calculation. By the close of Tuesday, the moving average got pulled up to 1 point above the low of the Monday.
Consequently, it is easy to assume that the Emini fell below the average and reversed up. However, in this example, that assumption is wrong. The strong bull close on the weekly chart as of Tuesday pulled the average above the low of the week. However, the low never actually fell below the average.
By Friday’s close, there was enough of a selloff from Tuesday’s close so that the EMA fell back to one point below this week’s low. Hence, it has not been touched in 41 weeks. The odds are that the low will touch the weekly average within the next few weeks. Furthermore, it typically falls 20 – 50 points below once it finally touches.
Bull flag at the moving average
Had this week closed just a little higher, the moving average would have been pulled above this week’s low. Therefore, if a trader looked back at the weekly chart many weeks from now, he would have seen this week’s low below the average. He would have correctly assumed that the pullback tested the average. It does not matter that in real-time, it never got there. Because the week closed far enough above its low, the close pulled the average above the low of the week. While not accurate, traders will say that this week touched the average.
It does not matter that the assumption was wrong. Since many traders and computers will conclude incorrectly that the pullback reached the average, all that matters is their conclusion. It is irrelevant that their reasoning was wrong. They will look to trade based on the assumption that it did. As a trader, that is the only concern, not what really happened.
That did not happen this week. I am only making a point about how moving averages work. This week’s low ended up just above the moving average. While that is close enough for the bulls to conclude the test is over and the bull trend will resume, the odds are that the Emini has to trade below the average soon.
Moving average gap bars
The low of each of the past 41 bars has been above the average. There is, therefore, a gap between each low and the moving average. These bars are all moving average gap bars. Once there are 20 or more, the bulls will usually buy the first pullback to the moving average. Therefore last week is a buy signal bar for the week August 28. Hence, this pullback is a 3-week bull flag.
Since 41 gap bars is extreme, the odds are that the pullback will last about 10 bars. Therefore, even though this week is a buy signal bar, there will probably be sellers above. Hence, the first reversal up will probably fail and lead to at least one more leg sideways or down.
Since the weekly chart is so strongly bullish, the break above this week’s high could lead to a new high. However, since a 10-week trading range is likely, that new high would probably reverse back down. Consequently, it would therefore probably simply be a failed breakout early in a developing trading range.
Daily S&P500 Emini futures candlestick chart:
Emini has begun 5 percent correction down to 2350
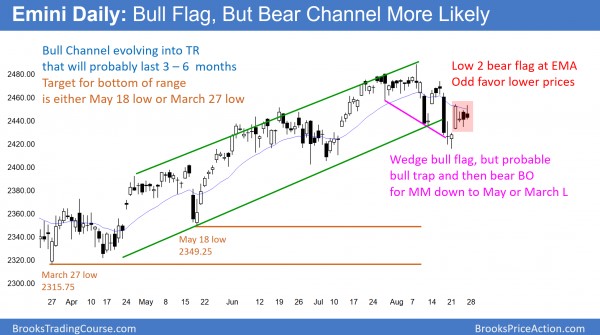
The daily S&P500 Emini futures candlestick chart is reversing up from a 2 legged pullback. It is also a wedge bull flag when including the July 27 low. Yet, it is forming lower highs in a bear channel and has a Low 2 bear flag going into Monday. Therefore it is in breakout mode.
The daily S&P500 Emini futures candlestick chart pulled back from the strong bull breakout August 22. This pullback is likely a bull flag. Furthermore, the Emini has a bullish bias from August 26 to September 5. This adds to the likelihood of a test up next week.
The bears need a series of major lower highs to continue their broad bear channel down from the all-time high. Consequently, if the bulls break strongly above the August 16 major lower high, most traders will conclude that the bulls won. They will assume that the Emini will be in a trading range or a bull trend.
However, the buy climax on the weekly chart is exceptionally overdone. As a result, 3 weeks down from the high on the weekly chart will probably not be enough for exhausted bulls to buy aggressively again. As a result, if there is a new high, it will probably fail. The bulls will probably take profits and the bears will sell again, looking for a 150 point correction down to the March low.
Broad bear channel
The Emini is in a broad bear channel. Therefore, the bears will sell again around the middle of the last leg down. Hence, that is around Tuesday’s high. Friday’s low 2 bear flag just below the moving average could be the start of the next leg down.
Since the Emini is seasonally bullish over the next week and there is a bull flag on the weekly chart, the odds are that the Emini will test higher over the next several days. If the bears are in control, they will start to sell again there, and especially at and below the August 16 major lower high. The math favors the bears, even if the Emini trades up a little next week.
Bull trap
There is a wedge bull flag created by the lows of July 27, August 10, and last week’s low. When there is a strong reversal up from a wedge bull flag, like on Tuesday, it creates a possible bull trap. The bulls bought strongly, confident that the bull trend is resuming. What will they think if the bears break below the bottom of the wedge bull flag? They will give up.
Whenever the Emini falls below an obvious location for a stop for the bulls, there is generally a 50% chance that the bear breakout will fail. This means that the bulls will get another reversal up.
However, the August 22 reversal up was very strong, and was created by confident bulls. If they get stopped out, many will be hesitant to buy again. In addition, the weekly buy climax will likely need 2 – 3 months before the bulls will return on the weekly chart.
Consequently, the odds that the bears would get a measured move down if they break below that wedge are almost 60%, not 50%. If they get a strong breakout and follow-through selling, the odds would rise to above 60%. This is because the trapped bulls would conclude that the 5% correction was underway and likely to test the start of the 6-month bull channel at the March low.


