

Global turmoil helped power gold to a breakout above $1300 recently. Here's what you should know about the risks if you trade, writes Jon Strebler, editor of Dow Theory Letters.
Get Trading Insights, MoneyShow’s free trading newsletter »
Last week we saw a breakout above $1300 for gold, and therefore judged the metal to be a buy — albeit a somewhat risky one.
After a nice little correction, gold got its second wind yesterday and zoomed higher. We looked at an intermediate-term P&F chart for gold last week, and a longer-term chart - so let’s check out the shorter-term action today.
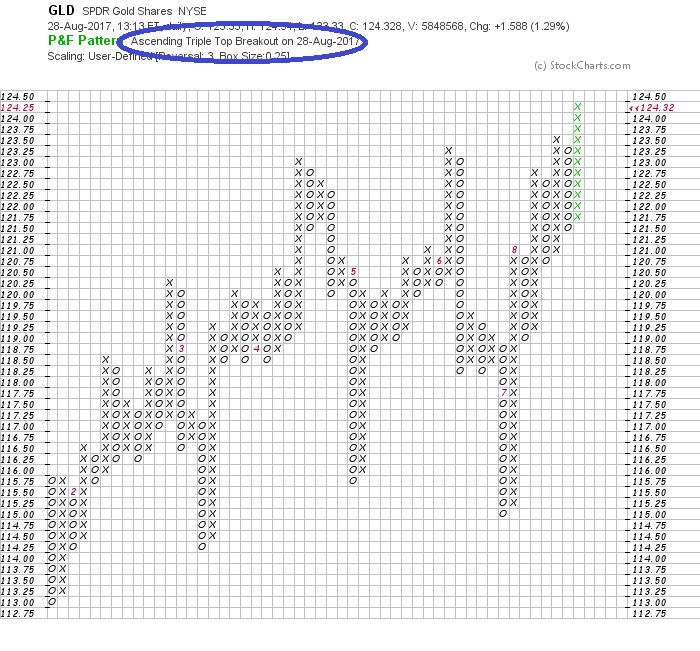
This is actually the chart of GLD, gold’s ETF. I’m using it because cash gold charts aren’t updated while the market is open, which is when I’m writing this. GLD tracks very closely with cash gold; you just have to sort of ignore the prices shown here, or else correlate them to actual gold prices.
Anyway – the chart shows this year’s Wild West action of big swings up and down, along with Monday’s second and more convincing break above $1300. Note the circled comment, which basically says this is a pretty bullish pattern.
As suggested last week, we may well see gold move into the high $1300s before running into big resistance – a move worth playing for those willing to take some risk.
One of the cautionary indicators we saw a few weeks ago was the gold and silver mining shares (XAU) underperforming the price of gold. That’s not usually a sign of a precious metals bull market. Well, along with gold moving again, the miners have sprung to life.
XAU’s July high of 86.74 has now been taken out, along with the big downtrend line shown in my August 15th column. Additionally, we now have the following picture of relative strength: GDX vs. gold.
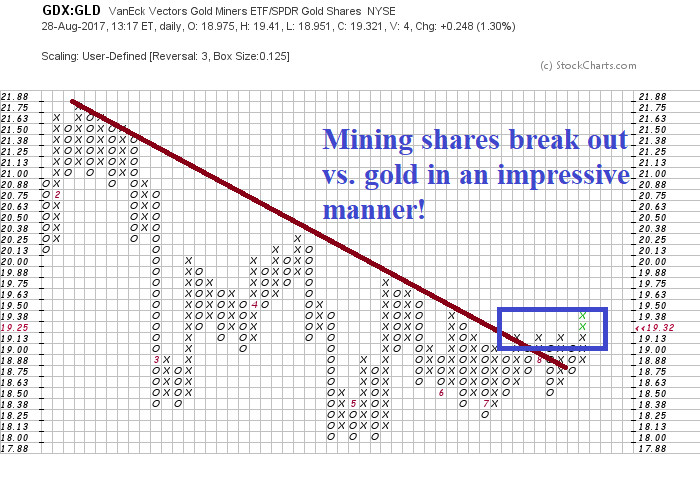
GDX is basically the ETF version of our XAU mining share index. Even though they’re not the same thing, GDX is what you’d actually buy and sell for the miners, as you can’t buy XAU. Anyhow, this is a SWEET chart, showing a big break through the very clear downtrend, and a quadruple-top breakout at the same time.
The implication is obvious: The gold and silver mining shares “should” outperform the metals themselves in the weeks and months ahead. That, in turn, gives support to the idea of a bullish trend in physical gold and silver.
Caveats: This is a fairly short-term chart, and we know not to read TOO much into those. Secondly, if we substitute XAU for GDX on this chart, the picture isn’t particularly bullish; that’s not reassuring. And did I mention that gold is again flashing an overbought warning on its RSI indicator?
Those cautions being understood, if one wants to participate in the expected continuation of this bull move in the precious metals, take a look at GDXJ, the ETF of smaller or “junior” mining companies.

Those smaller stocks tend to be even more highly leveraged than stocks included in GDX’s holdings, so GDXJ usually moves up (and down) more than GDX or the metals themselves.
If buying gold here is somewhat risky, then buying GDX is even riskier, and buying GDXJ is the riskiest of them all; it also has the greatest upside potential. Just so we're all aware of the stakes here.
What we see on this shortish-term P&F chart is similar to the previous chart: an upside breakout above the maroon downtrend line, and above a spread triple-top. Actually, the triple-top shown here at 33.93 is a spread quintuple-top, except for that move above it back in June – identified by the maroon arrow.
From this chart, it looks as if a move above $35.50 or so sets up a run at the year's high above $42. So this breakout could turn out to be a pretty big deal, if GDXJ can continue just a bit higher and break above that June high.
LATE NOTES: N. Korea flew a missile over Japan, and gold soared even more early Tuesday, while stocks and the dollar sank. That sent gold even more into overbought territory, on top of yesterday's virtual unanimous pronouncements of a new gold market. Can you say: Contrary opinion?
Once again, people decided WWIII is not imminent, and the metals sold off as stocks rallied back. Yet ignoring yesterday's and today's drama, the intermediate-term trend in gold is higher and we are just now entering gold's strongest time of the year, seasonally. Buying dips there is probably not a bad idea — in modest amounts.


