

The market remains very resilient. The bulls appear to be in control again after the bears were unable to take the market down, notes technical expert Bonnie Gortler, contributing editor to Signalert's Systems & Forecasts.
Get Trading Insights, MoneyShow’s free trading newsletter »
Major averages are at or very near their highs after the recent short term decline. Investors continue to be enamored with technology stocks. Apple (AAPL) is leading the way, making new all-time highs this past week. However, intermediate momentum patterns are weakening.
The good news is the market is oversold on a short term basis, suggesting more gains in the early part of the month are a good possibility. However, keep in mind that September is not a favorable month historically.
Also, intermediate and long term chart patterns are not in favorable position. Many have potential negative divergences that could cause the rally to fizzle if the buyers turn to sellers. Our models remain overall neutral-positive for the intermediate term (weeks-months). If there is a decline, it should be limited.
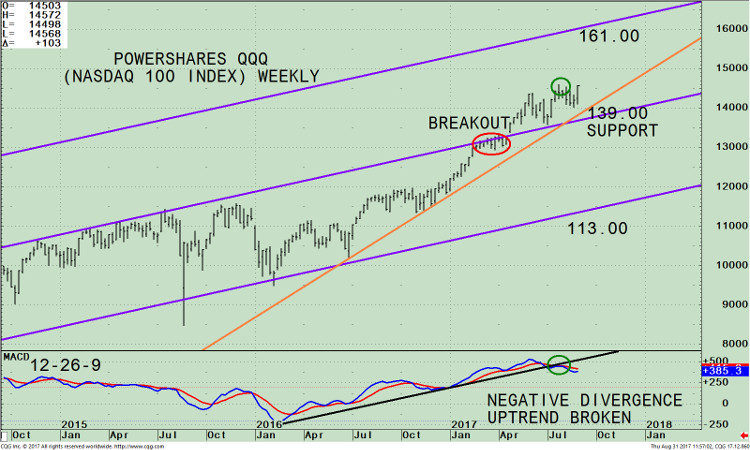
The top part of the chart shows the weekly PowerShares 100 (QQQ), an exchange-traded fund based on the Nasdaq 100 Index and its operative trend channel. The QQQ includes 100 of the largest domestic and international non-financial companies listed on the Nasdaq stock market based on market capitalization.
As of 08/30/17, Apple, (AAPL) is the largest holding comprising 12.51%, Microsoft Corp (MSFT) 8.40%, Amazon.com, Inc. (AMZN) 6.80%, Facebook, Inc. Class A (FB) 5.90%, Alphabet Inc. Class C (GOOG) 4.74%, and Alphabet Inc. Class A (GOOGL), 4.13 % totaling 42.48%.
The QQQ breached the middle channel after a 9-week consolidation (red circle) on 04/24/17. Buyers stepped in and the QQQ rallied for several weeks. However, the rally was not strong enough to reach the upper channel.
At the present time, the QQQ has successfully pulled back for the second time, testing the breakout from June, as of this writing at 145.48. The intermediate trend remains up as long as the QQQ remains above its trend line (see the orange line).
As long as the QQQ remains above key support at 139.00, the QQQ could work its way higher, potentially to the upside channel objective at 161.00.
If the QQQ falls below 139.00 on a weekly close, this would change the intermediate trend from up to down, implying some weakness could occur, potentially to the lower channel at 113.00.
The bottom half of the chart is MACD (12, 26, 9), a measure of momentum. MACD is giving a different message from price.
In June, MACD confirmed the price high suggesting further gains ahead and any decline would be short lived and contained. This is not what MACD is saying now. MACD has given a sell. Notice the clear negative divergence in MACD (green circles).
Price made a high that wasn’t confirmed by MACD. The sell might be a bit early, however tops take a longer time to form than bottoms.
I recommend keeping an eye on the top holdings in the QQQ over the next several weeks for when and if they start to decline and causing pressure on the QQQ, giving an advanced warning of a trend change.


