

EFA appears to be an attractive intermediate-term holding for as long as our models remain neutral-bullish (or bullish). The lower Bollinger band (now 65.70) is a good bottom fishing area, asserts Marvin Appel, MD, PhD, of Signalert Asset Management.
Get Trading Insights, MoneyShow’s free trading newsletter »
The chart below shows the iShares MSCI EAFE Index ETF (EFA) and its medium (12-26-9 day) MACD. Note that EFA has been moving sideways since June 2. Everything in this chart is consistent with the absence of a trend.
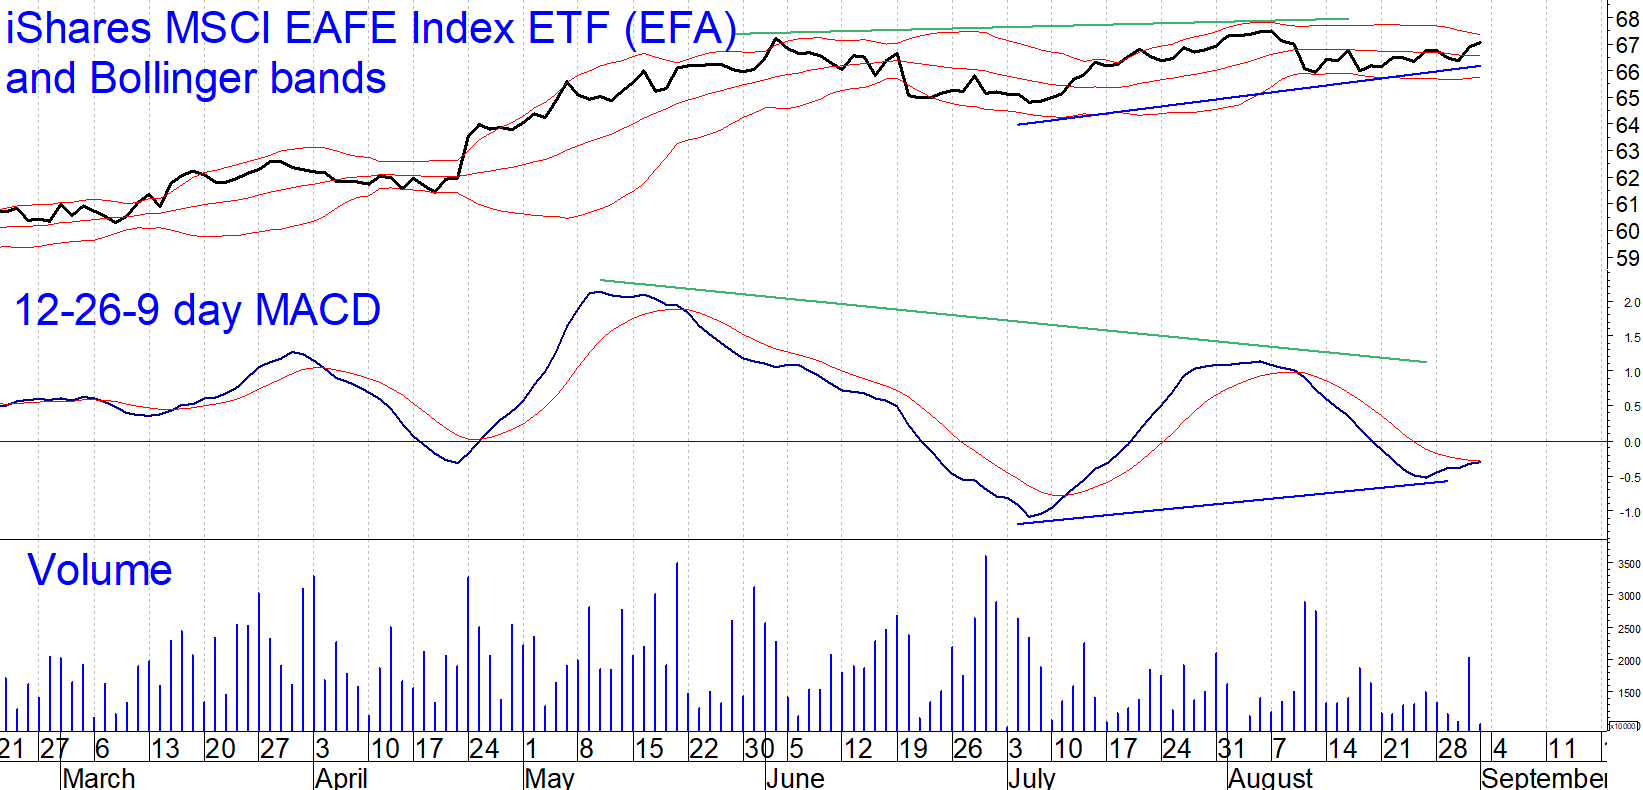
First, the Bollinger bands are horizontal and fairly narrow. EFA is right at the middle band.
Second, MACD has formed two conflicting patterns. On the one hand, we see a negative divergence for June-August, when the August high topped June’s peak price but the August MACD peak fell well below May’s. This is normally bearish, so it is a testament to the underlying bullish fundamentals that EFA has not given up any ground.
On the bullish side, we see a rising double bottom in MACD and in price from the July low to the August low. If EFA can hold its ground here, which I expect, we will see a fresh MACD buy.
I think the bulls will end up winning this one. EFA appears to be an attractive intermediate-term holding for as long as our models remain neutral-bullish (or bullish). The lower Bollinger band (now 65.70) is a good bottom fishing area. In the absence of a 2% retracement to the lower Bollinger band, stay the course.
Subscribe to investment newsletter Systems and Forecasts here…


