

The 1-minute Emini is fast and challenging. Do not attempt this with real money until you feel confident. Each day brings a slightly different vibrational relationship, asserts Jeff Greenblatt, director of Lucas Wave International and editor of The Fibonacci Forecaster.
Get Trading Insights, MoneyShow’s free trading newsletter »
Most Fibonacci and Elliott practitioners routinely look for wave relationships that have golden spiral proportions. The gospel is such that waves have either .618, 1.618 or 2.618 relationships to each other. If that doesn’t happen, many of us are stuck because we don’t know what to do.
Many times, in the absence of some other signal, it is an opportunity lost. In this small case study of the YM, I’m going to take you one step beyond the golden spiral.
Here is the 1-minute YM from Wednesday morning (Sept. 6). It is a choppy sequence but several good setups present themselves, if you know what to look for.
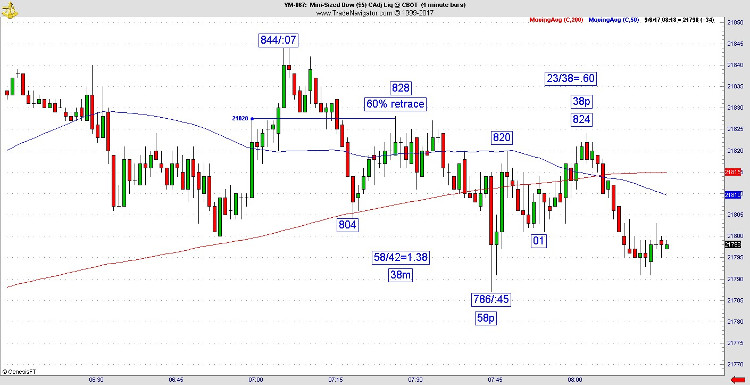
Let us start at the 60% retracement line at 828 which is 21,828 but it’s best not to clutter the chart with lengthy annotations. This is an opportunity that presents itself because it is a flip in polarity where former support turns to resistance.
In the morning the pattern started out bullish but had a quick turnaround. It’s highly possible that little support area at the horizontal line had people trying to buy a dip and they left sell stops below their trades. When it was retested there were no longer buys at that level. So, it created some downward pressure.
But look at the high at 844, the low at 804 and the tail at 828. That’s a 24-point retracement of a 40-point drop which is 60%. On this quick moving 1-minute charts it’s tough to get an exact 61.8, so a close approximation is good enough. Anyone who took this trade would have taken out some part of a 42-point move in less than 18 minutes.
The next thing to analyze is the turn. The last leg is 42 points while the entire move is 58 points. Quick math shows us a ratio of 1.38. Why is that significant? The time for the entire move is 38 minutes.
Before I get some email, realize that depending on the data supplier, you could be a minute off here or there. These little discrepancies get washed out in the long-term. Unless you trade a 1-minute chart you’d never notice it. In the internals of this leg, we have the short setup at the golden spiral 60%. Overall, the two larger waves end up with a 38 vibration which plays out in the ratio and the time. Price and time square out.
That next low at 786 even as it lines up would have been very hard to catch because the reversal happens lightning quick. The value in showing you this is not every setup will be lightning quick. These “other than golden spiral” relationships happen all the time. My laboratory is the 1-minute YM but you can find relationships like this on many instruments in different time frames.
The next high materializes because of another golden spiral where the entire leg is 38 points and that last leg is 801 to 824. The ratio of 23/38 is .60 and it is near prior resistance. Another point to note is after the 38-vibrational low, here we have another 38-point leg. This reversal is not lightning fast and ultimately was a 33 point drop in 11 minutes.
Here are some pointers to be aware of. The 1-minute Emini is fast and challenging. Do not attempt this with real money until you feel confident you know what you are doing.
Each day brings a slightly different vibrational relationship. Some days golden spirals work better than others. Be aware of support and resistance, while at the same time respect the bias of the day.
Do not look for reversals if you are dealing with an all-in day in either direction.
Here’s the good news. There is a process of wiring your brain for success called neuroplasticity. The more tendencies you observe, the quicker your brain will digest and recognize them as time goes on. It is recommended to work with this or any new methodology on a simulator first.


