

Eventually the bull channel transitions into a trading range. Then, traders get ready for a new breakout up or down, which would start the market cycle over again, asserts Al Brooks.
Get Trading Insights, MoneyShow’s free trading newsletter »
Monthly S&P500 Emini futures candlestick chart:
Parabolic wedge buy climax
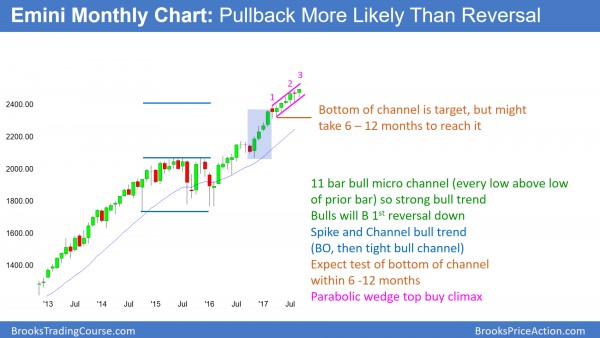
Every bar for the past 10 months on the monthly S&P500 Emini futures candlestick chart has a low above the low of the prior bar. This is an 11 bar bull micro channel. The 4-month breakout through February is a spike in a spike and channel bull trend. The channel began with the bear doji in March, which was the 1st pause after the breakout.
The monthly S&P500 Emini futures candlestick chart is in a strong bull trend. Yet, a micro channel (every bar has a low that is above the low of the prior bar) is unsustainable. It is a buy climax. However, there is no top yet. Furthermore, when a bull trend is this strong, the bulls will be eager to buy below the low of the prior month.
Advertisement
Consequently, the best the bears can probably get is a 1 – 3-month pullback, maybe to the March low where the channel began. While that 200 point reversal would be a bear trend on the daily chart, it would be a bull flag on the monthly chart. Hence, the reversal will be a pullback instead of a bear trend. As a result, the downside risk over the next few months is small.
Weekly S&P500 Emini futures candlestick chart:
Tight bull channel, but climactic
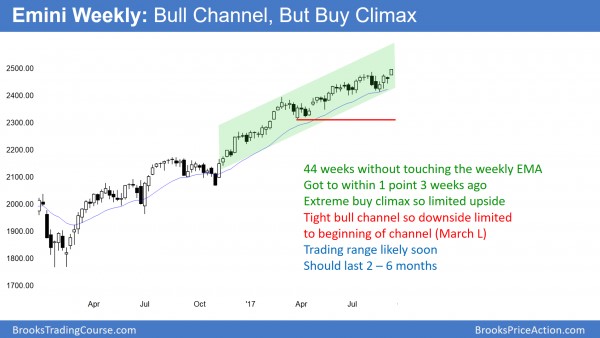
The weekly S&P500 Emini futures candlestick chart is in a tight bull channel. It is therefore in a strong bull trend. Furthermore, it might gap above the 2500 Big Round Number next week. However, it has not touched the 20-week exponential moving average in 44 weeks. This is extreme behavior and therefore unsustainable and climactic.
The weekly Emini chart this week closed on its high at a new high, just below the 2500 Big Round Number. This increases the chances that Monday will gap above the 2500 resistance, creating a gap up on the weekly chart as well. The bulls would then try to keep the gap open and create another strong bull trend bar next week. If they can then get a follow-through strong bull trend bar on the week after next, they might get at least 2 legs up over the next several weeks.
The weekly S&P500 Emini futures candlestick chart has been in a tight bull channel for 44 weeks. That is a strong bull trend. Consequently, when the bears finally create a breakout below the bull trend line, the reversal will be minor. This means that is will become a bull flag or a trading range and not a bear trend.
Because the buy climax is so extreme, when there is a pullback, it might be deeper and last more bars than expected. For example, the Emini held above the weekly moving average for 50 bars in 2003. It then went sideways for about 10 months. In addition, the bottom of the trading range was about 10% below the high. If the current rally has a comparable pullback, the Emini could fall more than 200 points. Furthermore, the exhausted bulls might need 6 months or more before they would buy again for another leg up.
Whether or not the bulls get a gap up and strong bull trend next week, the bears will try to reverse the breakout down. However, they need to create either a big bear trend bar or a bear reversal bar over the next 2 weeks. Without that, the odds still favor higher prices.
Daily S&P500 Emini futures candlestick chart:
Broad bull channel
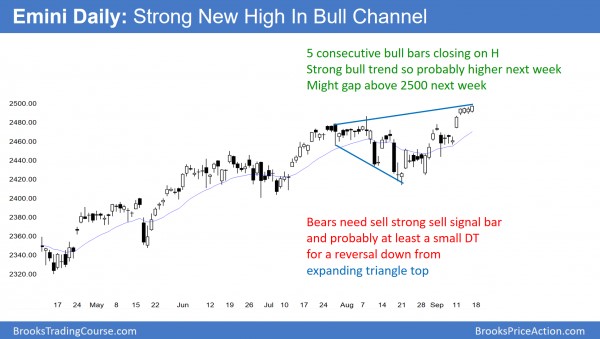
The daily S&P500 Emini futures candlestick chart has been in a broad bull channel since the March low. After 5 days closing on their highs, the odds favor higher prices next week.
The daily S&P500 Emini futures candlestick chart has been in a broad bull channel since March. While a channel can continue indefinitely, it usually evolves into a trading range after 3 – 5 legs up. The current rally is the 5th leg up. There is, therefore, an increased chance that the next leg down will break below the bottom of the channel.
Furthermore, once there is a break below a channel, the Emini usually eventually sells off to the start of the channel. That is the March low of 2314.00. Once there, the bulls usually return and the bears buy back their shorts. As a result of both the bulls and bears buying, the Emini usually rallies. At that point, traders will conclude that the bull channel had evolved into a trading range.
When a bull channel evolves into a trading range, the bear leg usually lasts at least half as long as the bull channel. Since the bull channel has lasted 7 months, once there is a selloff, it will probably last at least 3 months. This is consistent with the duration of the eventual pullbacks on the weekly and monthly charts.
FOMC interest rate announcement is a catalyst
Most reversals begin with a news event. News surprises can come at any time, but some news events are predictable. For example, Wednesday’s FOMC meeting has the potential to surprise traders. If the Federal Reserve says something unexpected, that could lead to the start of a correction.
Since most reversals fail, the odds are that any reversal attempt over the next few weeks will lead to a small trading range and not the start of a 200 point correction. Yet, because the weekly and monthly charts are so extremely overbought, there is an increased risk of a correction at any time.
Bull breakout above bull channel is unlikely
Although most bull channels have bear breakouts, about 25% of them have strong bull breakouts. The most dramatic example is the monthly chart of the S&P cash index in 1995. When that happens, the market cycle starts over. The breakout eventually has a pullback. At that point, the strong bull trend enters a bull channel. Eventually the bull channel transitions into a trading range. Then, traders get ready for a new breakout up or down, which would start the market cycle over again.


