

Continue to trade largely from a bullish posture, but keep your stops tight. Don’t short this market, asserts Kerry Given, PhD, founder of Parkwood Capital and a co-founder of G&L Capital Management.
Get Trading Insights, MoneyShow’s free trading newsletter »
The Standard and Poor’s 500 Index (SPX) broke out on Monday (Sept. 11) to set a new all-time high, but that was only the beginning of a very bullish week for stocks. SPX closed Sept. 15 at 2500, the fourth new all-time high this week.
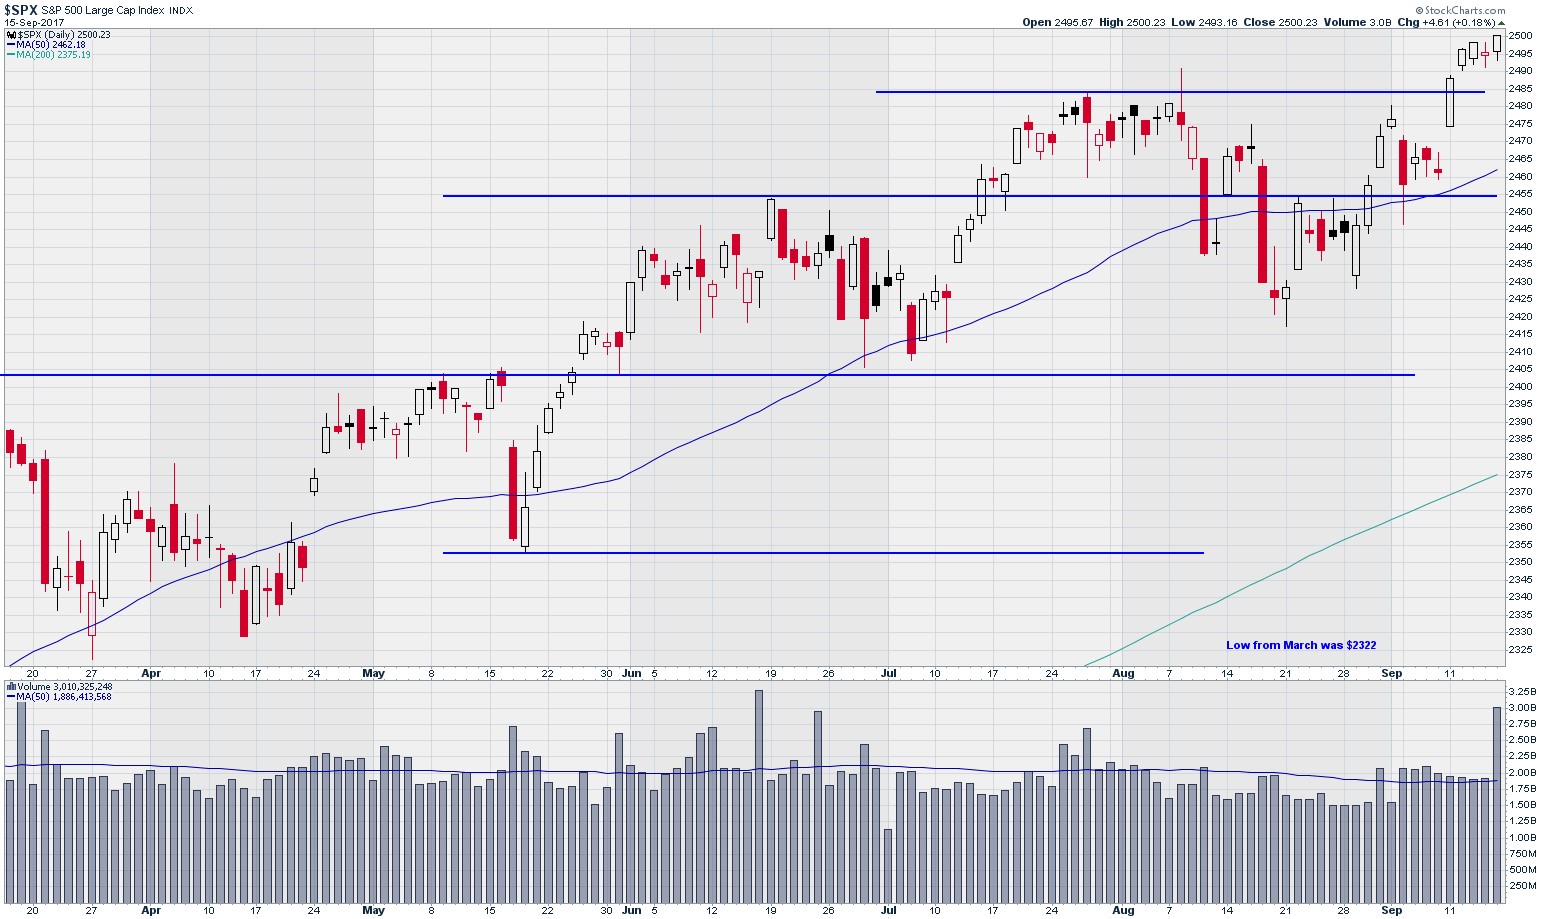
Standard and Poor’s 500 Index (SPX)
Chart courtesy of StockCharts.com
Trading volume of the S&P 500 companies trended right at or just above the 50-day moving average (dma) all week, but spiked much higher Sept. 15, up to 3.0 billion shares, as compared to the 50 dma at 1.9 billion shares.
The Sept. 15 spike higher was due to what is called “quadruple witching,” the expiration Friday each quarter when stock index futures, stock index options, stock options, and single stock options all expire. This always results in a trading volume spike higher.
The recent trends in trading volume may be instructive. If we ignore the quadruple witching exception, last week’s trading volume, as the market hit new all-time highs, was lower than the previous week, as the market was faltering. That tells me that traders are primarily focused on a fear of correction and avoiding losses. Market commentary seemed to focus on rationalizing why the market continues higher in spite of congressional dysfunction and North Korea’s saber rattling.
Advertisement
Traders were worried about hurricane damages, and the week closed with everyone focused on North Korea’s Founders Day and what the short fat tyrant might do to celebrate.
But Monday came and it was a rerun of Happy Days. The hurricanes were suddenly ancient history and even after North Korea launched another ICBM and London endured another terrorist attack before the market opened this morning, the market remained ebullient.
The thrust higher is evident in the Bollinger bands. SPX hit the upper edge of the bands on Sept. 11 and stayed there Tuesday and Wednesday. If we repeat the pattern we have been observing most of the year, this run along the upper edge of the bands is likely to precede a slow of the market’s advance in the coming week.
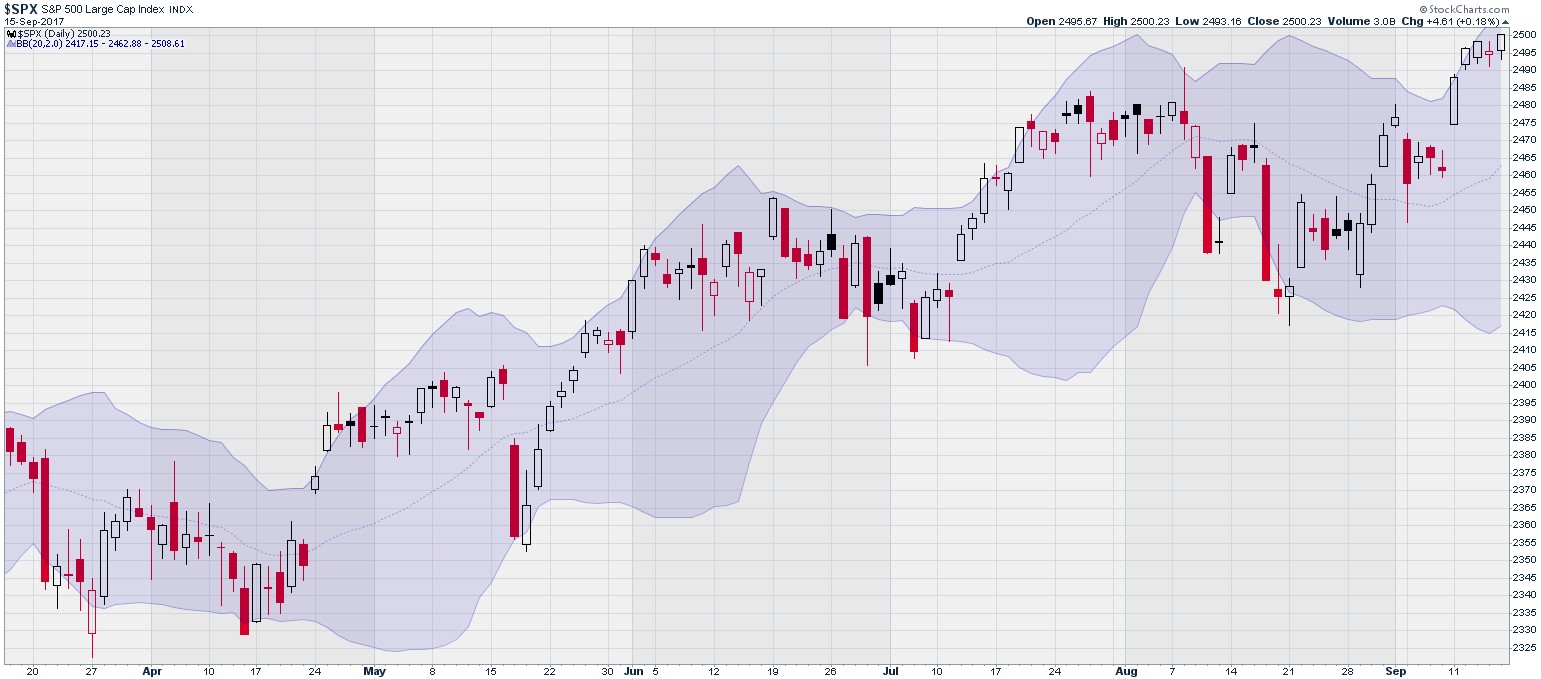
Standard and Poor’s 500 Index (SPX) with Bollinger Bands
Chart courtesy of StockCharts.com
The Russell 2000 Index (RUT) took a breather from its remarkable bullish run that started in late August. RUT joined its big brother indexes and ran higher, but the difference is that Russell remains well short of its all-time highs that were set back in July.
The collapse of RUT from July 28 to August 21 covered 6.4% - near market correction territory. Its run higher since then has been significant, up 5.4%, but it had a lot more to recover than SPX and the NASDAQ Composite.
RUT closed Sept. 15 at 1432, well short of the 1450 close on August 25. RUT seems to be behaving as the leveraged version of the S&P 500 Index. In one sense, this isn’t surprising since RUT is made up of higher beta stocks, but the behavior over the past several weeks seems extreme. Why didn’t I buy RUT Sept. calls?
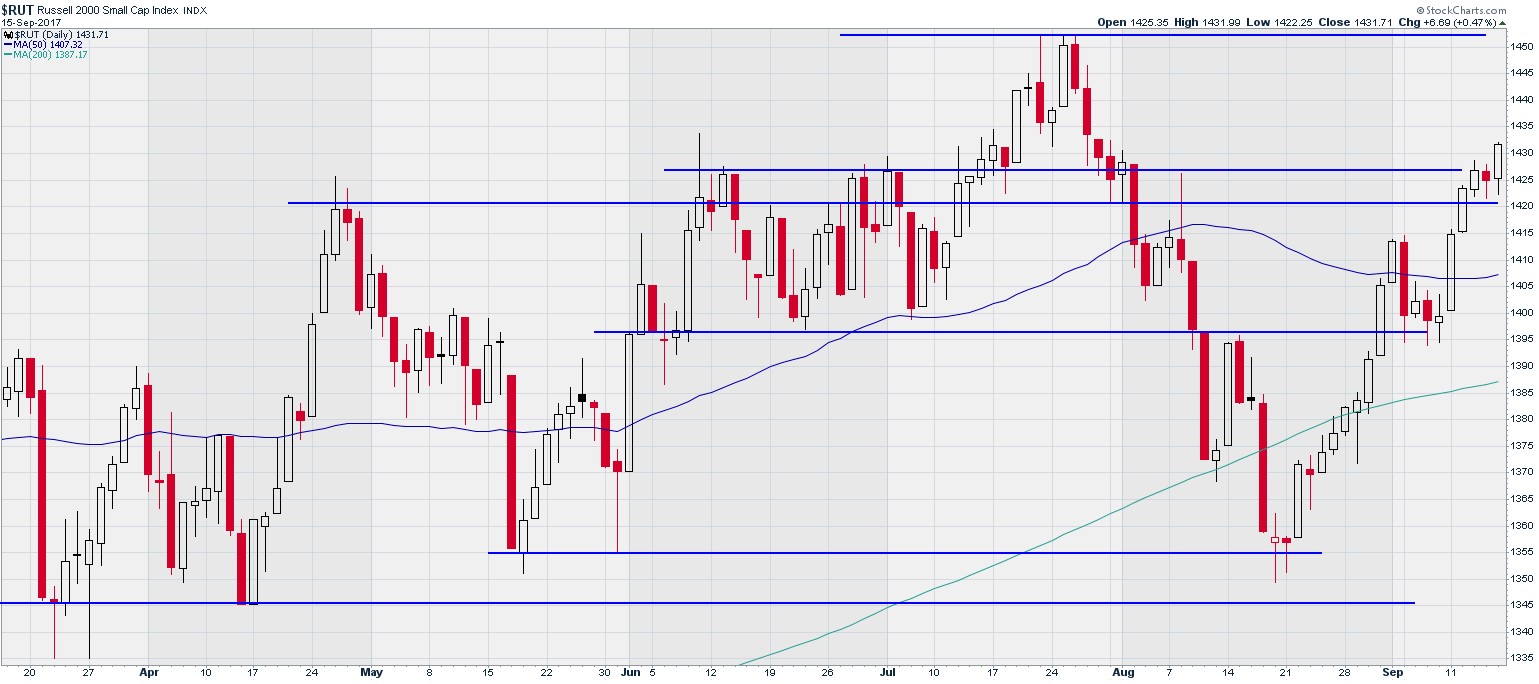
Russell 2000 Index (RUT)
Chart courtesy of StockCharts.com
The NASDAQ Composite’s price action this week is unlike SPX or RUT. NASDAQ closed Sept. 15 at 6448, attempting unsuccessfully twice this week to break the resistance level set by the opening high of 6460 on July 27.
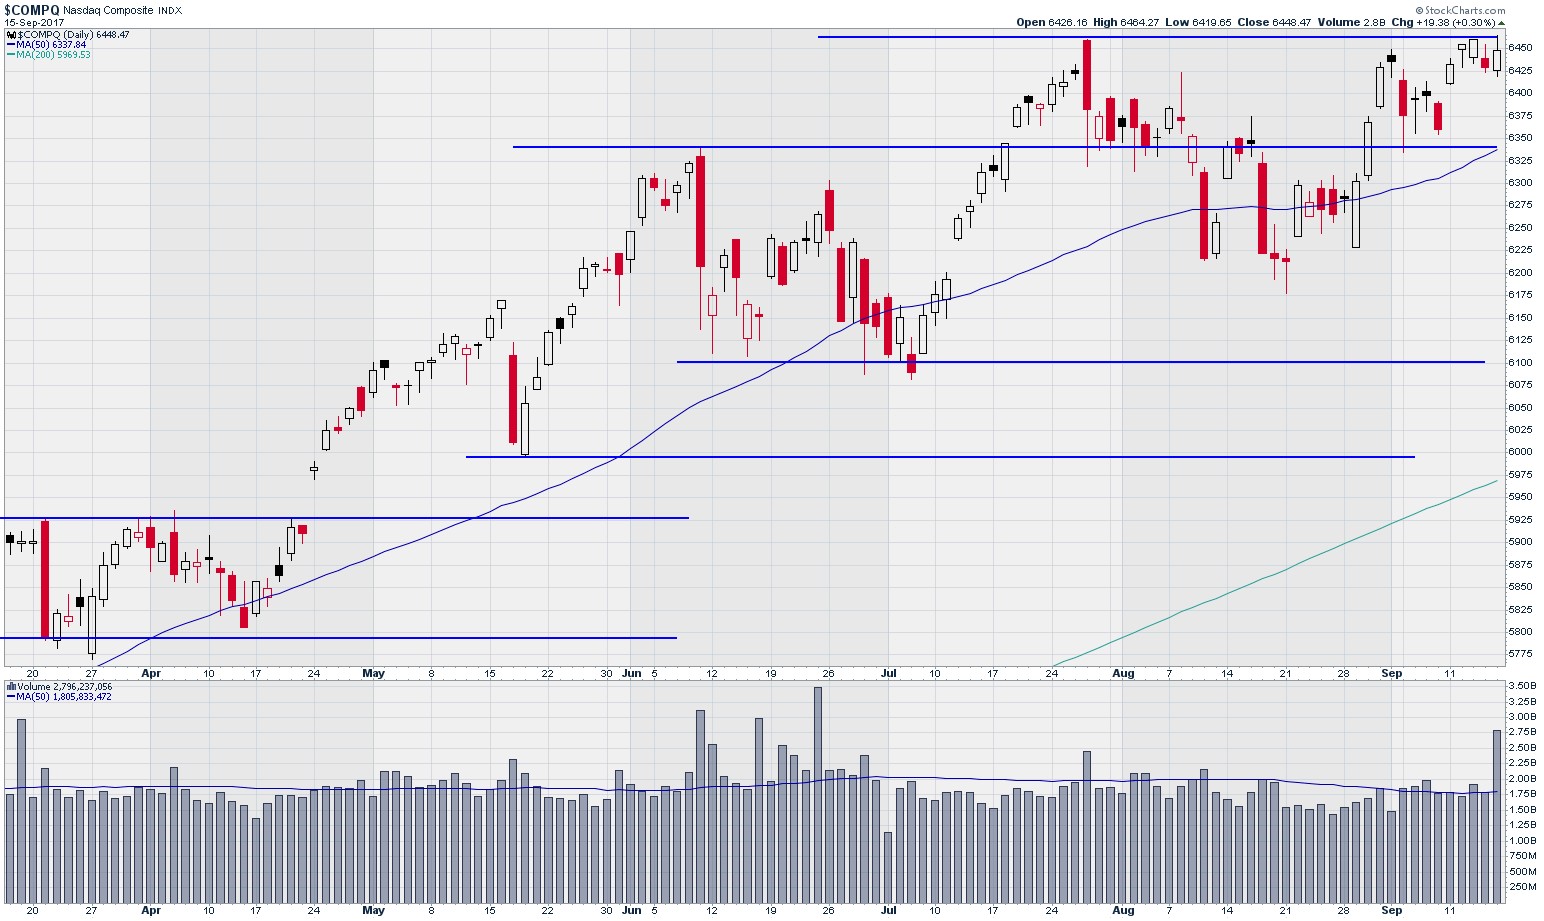
NASDAQ Composite Index
Chart courtesy of StockCharts.com
NASDAQ trading volume was similar to SPX, trading at or just under the 50 dma all week, with the exception of the Sept. 15 quadruple witching volume spike.
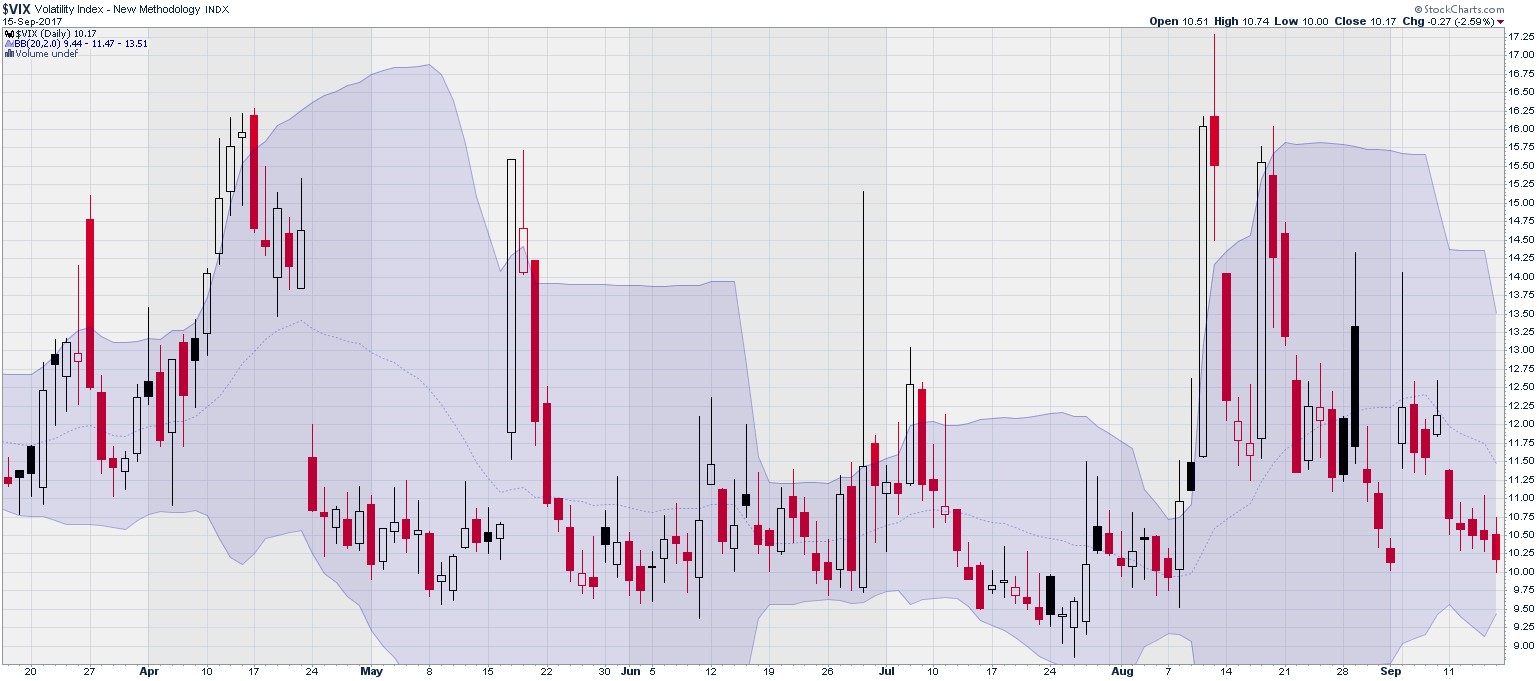
CBOE SPX Volatility Index (VIX)
Chart courtesy of StockCharts.com
Market volatility remains historically low. Standard and Poors 500 Volatility Index (VIX) moved lower all week, closing Sept. 15 at 10.2%. I read and heard market analysts expressing concern that such low levels of volatility must be predicting a correction, but they are proving the old adage that the market can continue trading however it wishes far longer than your money will last.
I displayed the price charts for SPX, RUT and NASDAQ for the past 18 months and looked for the overall long-term trend. The differences were intriguing.
Russell has run steadily higher since March 2016, but has largely traded sideways since May. However, Russell takes the prize for price volatility.
NASDAQ displays a solid uptrend from July 2016 through July of this year but is largely flat for the past six weeks or so.
The S&P 500 has the steadiest and most consistent upward trend line from March 2016 to the Sept. 15 close.
This index price chart comparison reinforces the conclusion that the overall market trend is bullish, but far from a high trading volume, “risk off” or “all in” bull market. Market participants are enjoying their gains but worried that it has gone too high, too fast. We see rapid dips that are just as quickly bought back to recover the bullish trend. The more defensive stocks of the S&P 500 display the steadiest and most consistent bullish trend.
The bulls are in control, but they are also nervous. Congressional dysfunction and North Korea are the monsters in the closet. Continue to trade largely from a bullish posture, but keep your stops tight. Don’t short this market. I was protecting my portfolio with long index puts Friday (Sept. 8) and was burned on the following Monday as the markets shrugged off everything to run higher.


